


Introduction
Seasonal patterns in the stock market can be as influential as the fundamental and technical aspects that traders typically analyze. This is particularly true for companies like United Parcel Service, Inc. (UPS), whose operations and stock performance show tendencies linked to specific times of the year. In the realm of investing, where every percentage point of return can be pivotal, understanding and capitalizing on such trends is invaluable.
As an eloquent content writer with a passion for demystifying the stock market’s seasonality, my aim is to provide investors with a clear, accessible guide to a trading strategy that leverages these temporal patterns. Through meticulous backtesting and analysis, we uncover the potential of a monthly seasonality trading strategy that has shown promising results over nearly two decades.
Join me as we embark on a journey through the intricacies of a trading approach that is not about the frenetic day-to-day trading often associated with the stock market. Instead, it’s about the patience and precision of entering the market at opportune moments based on historical performance, with the goal of achieving growth without unnecessary risk. This blog post is your compass to navigating the seasonal ebbs and flows of UPS’s stock, offering a strategic blueprint for those investors keen to synchronize their trades with the rhythm of the calendar.
Company Overview
UPS (NYSE: UPS), a global leader in logistics and supply chain management, boasts a diverse portfolio of services including package delivery, freight transportation, customs brokerage, and more. With an expansive network spanning over 220 countries and territories, UPS caters to a vast spectrum of clients ranging from individuals to multinational corporations, empowering seamless movement of goods across the globe. Its revenue streams encompass a combination of domestic and international package deliveries, freight forwarding, and specialized services such as healthcare logistics and high-value shipping. UPS distinguishes itself through its commitment to innovation, consistently investing in cutting-edge technologies and optimizing its operational efficiency to deliver reliable, time-sensitive services. The company’s growth strategy centers around expanding its global footprint, diversifying its service offerings, and leveraging advanced analytics to enhance customer experiences. Operating in a highly competitive industry characterized by evolving customer demands, technological advancements, and regulatory shifts, UPS maintains a competitive edge through its extensive network, brand recognition, and unwavering dedication to customer-centric solutions.
Strategy Overview
United Parcel Service, Inc. (UPS) is a company that has woven itself into the fabric of global commerce with its comprehensive courier and logistics services. Investors and traders alike closely monitor UPS for its potential to yield returns in various market conditions, including seasonal trends. As we delve into the nuances of a particular trading strategy applied to UPS, it’s crucial to understand that this strategy revolves around monthly seasonality.
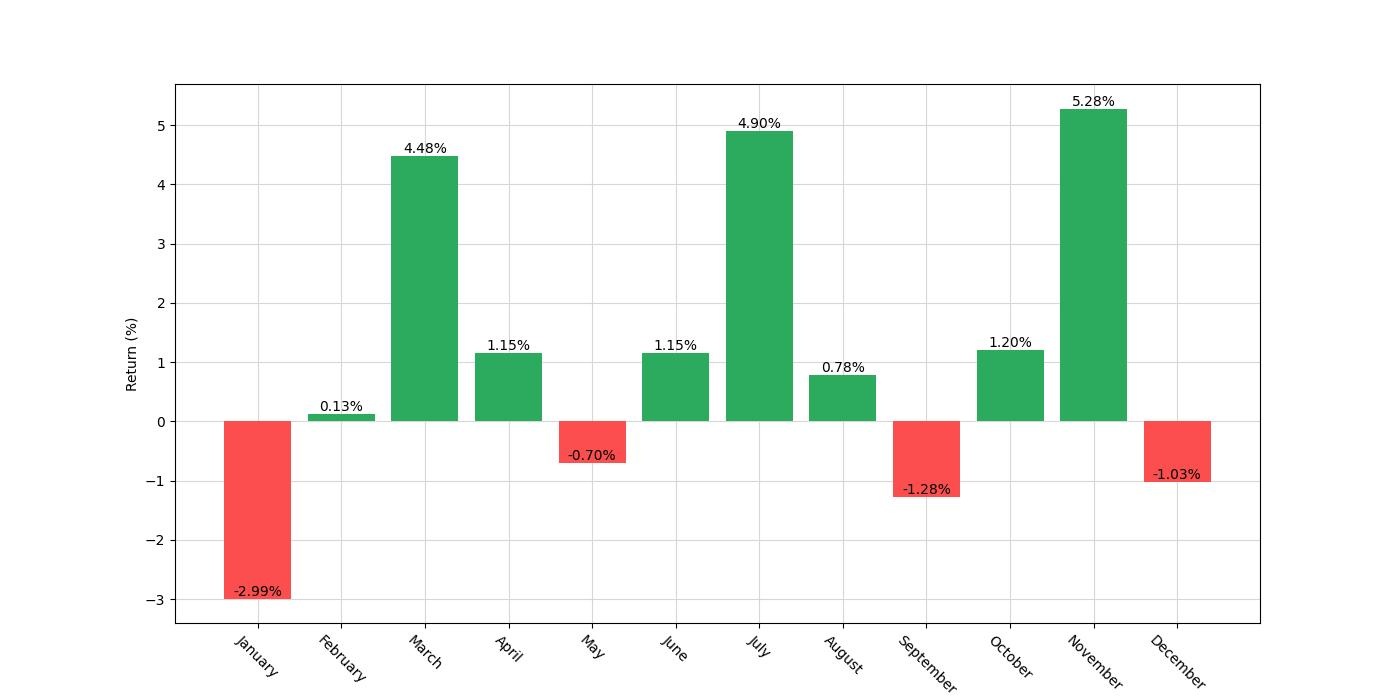
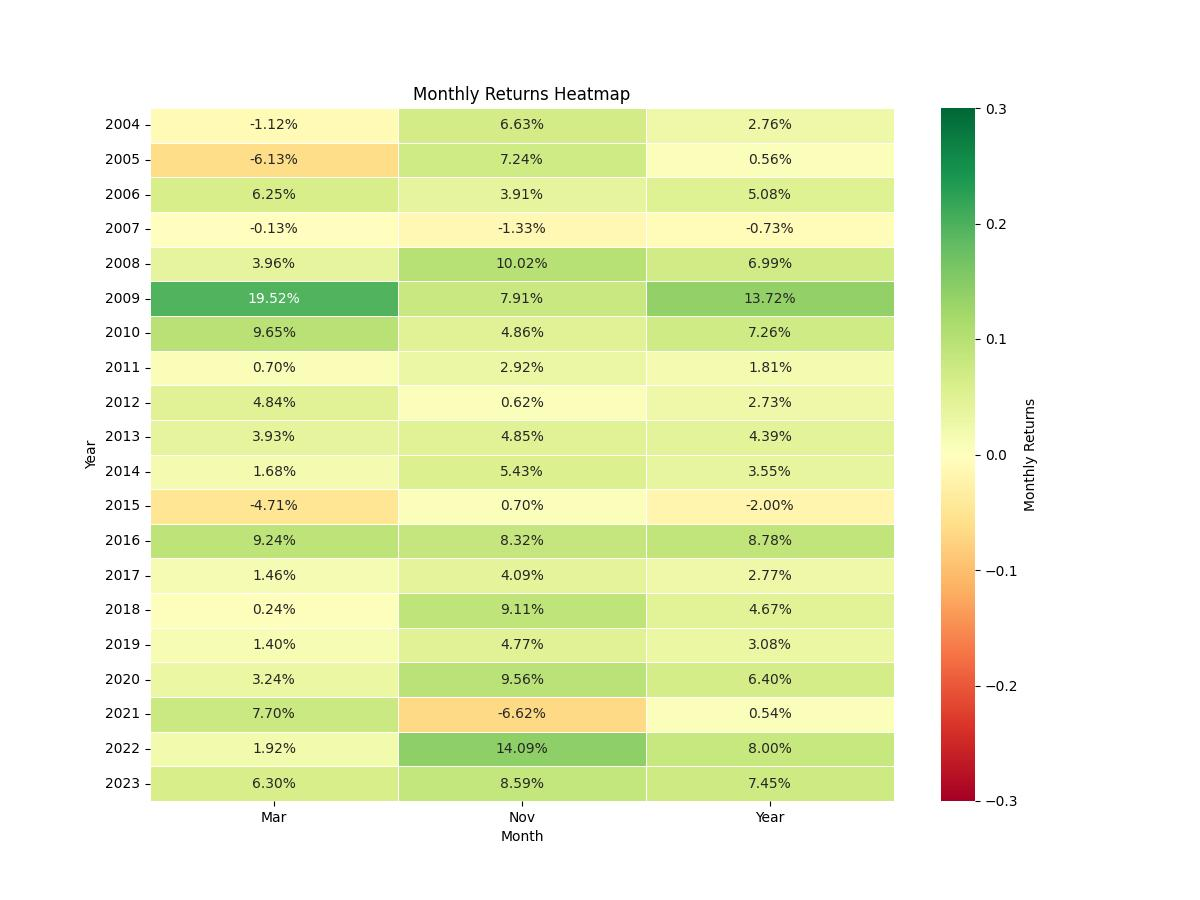
The backtesting of this strategy spans from January 2, 2004, to December 29, 2023, covering nearly two decades of UPS’s stock performance. This extensive period, encompassing 7,301 days, provides a robust dataset for analyzing the efficacy of the trading rules put to the test. According to the strategy, an investor would enter a long position at the close of the market in March and November each year, capitalizing on potential seasonal upswings during these months. It’s important to note that no short positions are taken at any point in the year, which means the strategy is purely betting on the stock’s upside during these identified periods.
The initial capital allotted for this backtest was $10,000—a figure that represents a common starting point for many individual investors. One of the striking aspects of the strategy is its relatively low market exposure. Positions are held only during March and November, which translates to an exposure time of approximately 17.72% of the total duration of the backtest. This indicates that the strategy is not aggressive in terms of its frequency of trades but rather selective, focusing on specific time windows to execute trades.
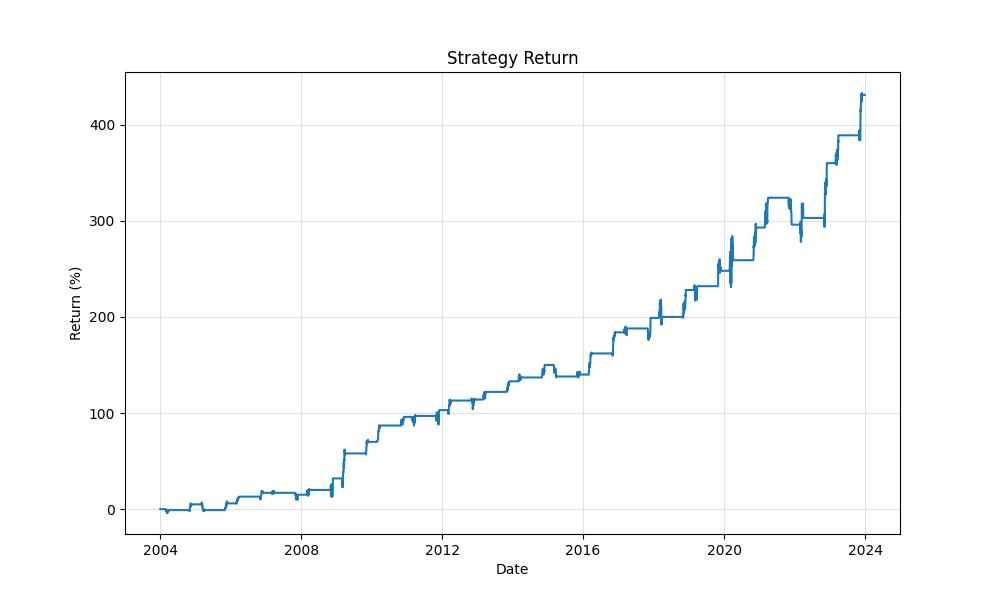
Backtesting results show a significant increase in equity, with the final equity standing at $53,089.05, and the equity peak slightly higher at $53,327.05. This outcome suggests a return of 430.89%, vastly outperforming the buy-and-hold return of 274.88% during the same period. On an annualized basis, the strategy yielded a return of 8.72%, which is indicative of a methodical growth pattern over the years without the need for constant market participation.
These results are quite revealing as they underscore the potential benefits of a seasonal trading approach with limited market exposure. By focusing only on specific months that historically show positive tendencies, the strategy attempts to harness the cyclical nature of UPS’s stock performance with a disciplined and time-specific entry point. The data reflects the strategy’s ability to capitalize on these seasonal trends effectively, turning a modest initial investment into a substantial equity sum over the course of nearly two decades.
Key Performance Indicators
In the world of investing, performance is king. Let’s dive into the heart of the strategy’s results and understand what the numbers are telling us about the monthly seasonality trading strategy applied to United Parcel Service, Inc. (UPS).
The strategy commenced on January 2, 2004, and ran through December 29, 2023, marking a period of just shy of two decades. During this time, an investor who began with an initial capital of $10,000 would have witnessed their equity swell to an impressive $53,089.05. To put this into perspective, this represents a cumulative return of 430.89%, a striking contrast when compared to the 274.88% return an investor would have earned through a simple buy-and-hold approach over the same period. This outperformance indicates the efficacy of the strategy in capitalizing on UPS’s seasonal strengths.
But it’s not just about overall returns; it’s also about consistency and reliability. A deeper look into the annualized return, which smooths out the returns over the years to give a clearer picture of what an investor might expect in a typical year, shows a respectable 8.72%. This figure stands tall against the 6.81% annualized return from a buy-and-hold strategy, underscoring the advantage of engaging with the market at strategic times instead of remaining passive.
At the peak of the strategy’s performance, the equity reached $53,327.05, slightly above the final equity, indicating that the strategy maintained its gains and avoided significant downturns towards the end. This is a positive sign, suggesting that the strategy did not just hit a lucky streak but instead offered sustained growth over time.
The differences in these performance metrics between the trading strategy and the buy-and-hold approach speak volumes. They reveal that while the buy-and-hold strategy certainly has its merits, particularly for those investors seeking a hands-off approach, engaging with the market by leveraging the seasonal trends of UPS shares has proven to be more lucrative over the test period.
Risk Management
As investors, understanding the risks associated with our trading strategies is paramount to achieving long-term success. A pivotal aspect of risk management is analyzing the potential volatility an investment may be subject to over a given period. In the context of our monthly seasonality trading strategy for United Parcel Service, Inc. (UPS), let’s delve into the relevant risk metrics that have emerged from our backtesting results.
Starting with the annual volatility, which reflects the degree to which the stock price has fluctuated historically, we’ve observed an annualized volatility of 11.497%. This is a significant figure, as it informs us about the ups and downs an investor might have experienced. A lower volatility often indicates a less risky investment, hence the 11.497% figure gives us confidence that the strategy has not been overly turbulent when compared to the broader market volatilities.
Now, let’s talk about the Sharpe Ratio, which is a tool used to help investors understand the return of an investment compared to its risk. The Sharpe Ratio for our strategy stands at 0.7582, which indicates that for every unit of risk taken, the strategy has generated a relatively moderate excess return. While a Sharpe Ratio above 1 is generally considered excellent, our ratio suggests that the returns have been satisfactory when weighed against the risk taken.
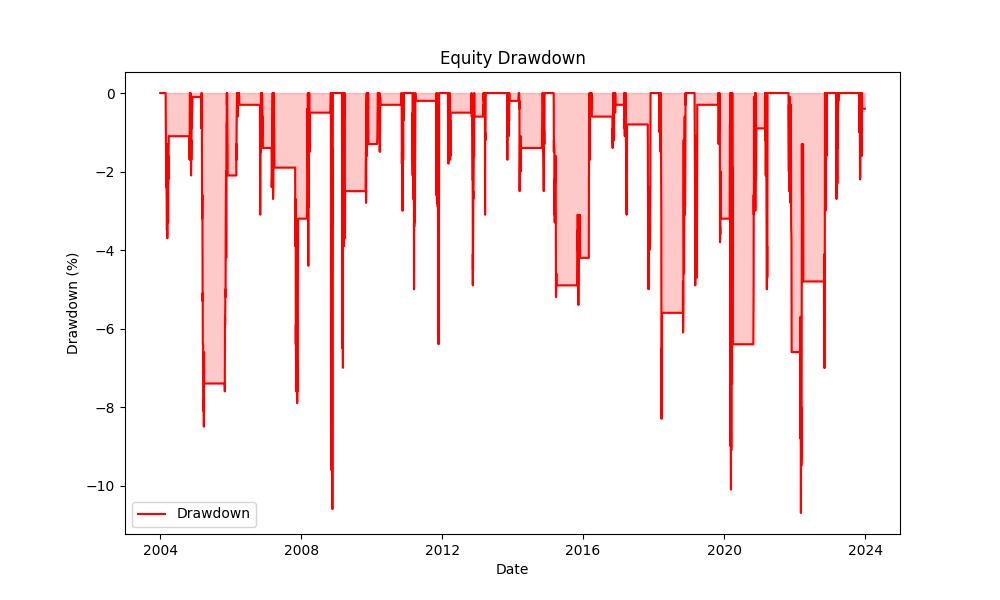
When we look at the maximum drawdown, which is the largest drop from peak to trough before a new peak is attained, our strategy has experienced a maximum drawdown of -10.706%. This is an essential figure because it helps us gauge the potential stress or loss an investor might have to endure during adverse market conditions. It’s a testament to the resilience of our strategy that the maximum drawdown has been kept to a relatively moderate level, especially when compared to the more significant downturns observed in broader markets.
The average drawdown, sitting at -2.3369%, provides further insights into the typical declines during the strategy’s underperforming periods. This lower average suggests that while the strategy does have down periods, they are generally not severe.
Moreover, the duration of these drawdowns is equally important. A maximum drawdown duration of 378 days indicates the longest time it took for the strategy to recover from its most significant loss, while the average drawdown duration of 60 days gives us an idea of how quickly the strategy typically rebounds from downturns. Quick recovery from drawdowns is an attractive feature for investors, as it implies less time with capital tied up in depreciating positions.
This comprehensive risk management profile is critical to investors as it lays bare the realities of the strategy’s performance during various market conditions. By examining these metrics, investors can better understand the balance between risk and reward and make more informed decisions aligned with their individual risk tolerances.
Trade Analysis
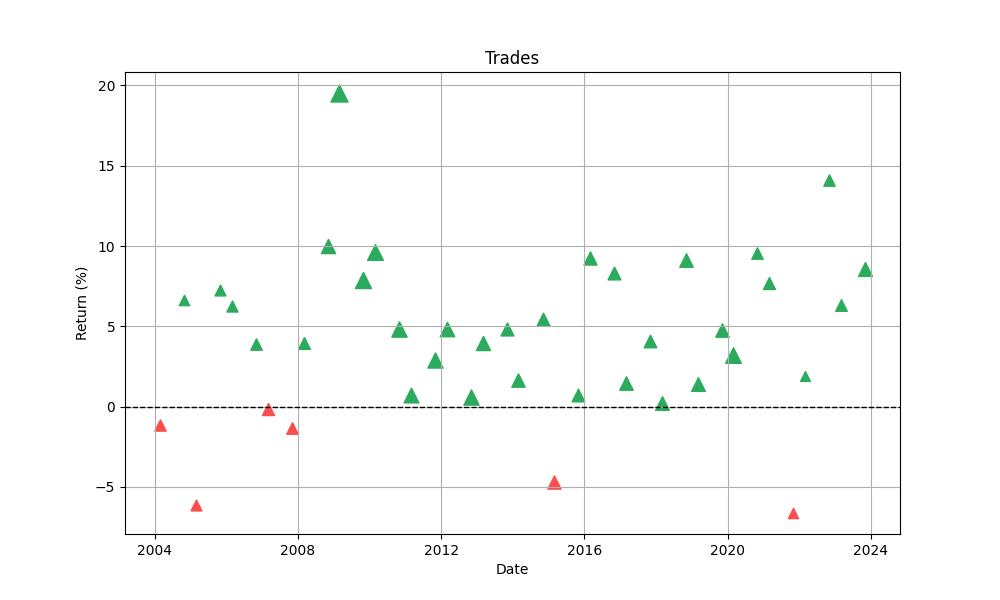
Diving straight into the heart of our trading strategy’s performance, we’ve meticulously scrutinized the statistics derived from backtesting this approach on United Parcel Service, Inc. (UPS). Over the course of our observation period, the strategy executed a total of 40 trades. This relatively low number is indicative of the strategy’s selectiveness, focusing on specific seasonal patterns rather than engaging in frequent transactions.
In an impressive display of consistency, the strategy boasted an 85% win rate. This high percentage of successful trades reveals the robustness of the seasonal pattern we’ve identified for UPS. It means that out of all the trades made, 85% have been profitable, which is a strong indicator of the effectiveness of the selected months for entering positions.
Looking more closely, the best single trade yielded a remarkable 19.52% return, underscoring the potential for significant gains during favorable seasonal windows. On the flip side, even the most tightly honed strategies encounter setbacks, and ours was no exception. The worst trade we experienced resulted in a 6.62% loss, a figure that, while not negligible, is dwarfed by the wins garnered through other trades.
On average, each trade brought in a 4.27% return. This figure is particularly telling as it smoothes out the highs and lows to give investors a realistic expectation of what each trade under the strategy might contribute to the overall portfolio.
In terms of holding periods, the strategy dictated that positions were held for an average of 31 days, with the longest trade duration stretching to 33 days. This month-long average trade duration aligns with the strategy’s monthly seasonality premise, reinforcing our focus on leveraging short, specific periods that historically show favorable market movements for UPS.
One of the most striking figures is the Profit Factor, sitting at an impressive 9.77. This metric speaks volumes about the strategy’s profitability, indicating that the gross profits from winning trades vastly outweigh the gross losses from losing trades. In essence, for every dollar lost, nearly $9.77 was gained, painting a picture of a highly efficient strategy in terms of risk-reward balance.
Lastly, the Expectancy figure stands at 4.39%. This number gives us a forecast of the average expected percentage return per trade, factoring in the probability and size of wins and losses. With a positive expectancy, investors can anticipate that, on average, each trade will contribute positively to the total returns.
Conclusion
In conclusion, the examination of the monthly seasonality trading strategy applied to United Parcel Service, Inc. (UPS) reveals an innovative approach to the stock market that leverages specific timeframes to capitalize on historical trends. The backtested data across nearly two decades illustrates that this method is not only successful in generating returns that surpass the traditional buy-and-hold strategy but also demonstrates a level of consistency and reliability that is attractive to investors.
The strategy’s performance, backed by key metrics such as a high win rate, respectable Sharpe Ratio, and moderate drawdowns, showcases its ability to balance risk and reward effectively. Moreover, the strategy’s limited market exposure and strategic timing provide a blueprint for investors seeking to optimize their market participation while mitigating the risks associated with constant market fluctuation.
Risk management analysis further solidifies the strategy’s credibility, presenting an investment approach that manages volatility and drawdowns in a way that could align with the risk tolerance of a wide range of investors. The trade analysis, with its high win rate and impressive Profit Factor, underlines the effectiveness of this seasonal strategy and its potential to yield substantial returns while maintaining a controlled investment environment.
As the stock market continues to evolve, strategies that adapt to the cyclical movements of specific stocks can offer a path to both growth and stability. The seasonal trading strategy for UPS, as detailed in this blog, serves as a compelling example of how investors can harness seasonal patterns to their advantage, turning time into a valuable ally in the quest for financial gain. While past performance is not indicative of future results, the insights derived from this analysis provide a strong foundation for those interested in exploring the seasonality of the stock market and deploying time-tested strategies in their investment journey.

“Make the invisible visible. My goal is to shine a light on the subtle seasonal signals in the stock market, providing investors with the insight needed to make informed decisions. By breaking down the complexities of seasonality, I strive to empower our audience with knowledge and foresight, turning data into action.”