For self-directed stock and ETF traders
Separate seasonal patterns from market drift.
On a stock that rose for twenty years, almost every calendar window looks like a winner. We test every weekday, month-end, holiday and calendar window across 1,456 US stocks and ETFs against holding the exact same asset for the exact same number of sessions, so market drift never fools you.
Free while membership opens. No card required. Accounts created now are offered the founding price first.
- Every year shown, the weak ones too
- Results since Jan 1, 2026 kept apart
- Seven SPY strategies with trade ledgers since the cutoff
Works in Claude, ChatGPT and Gemini
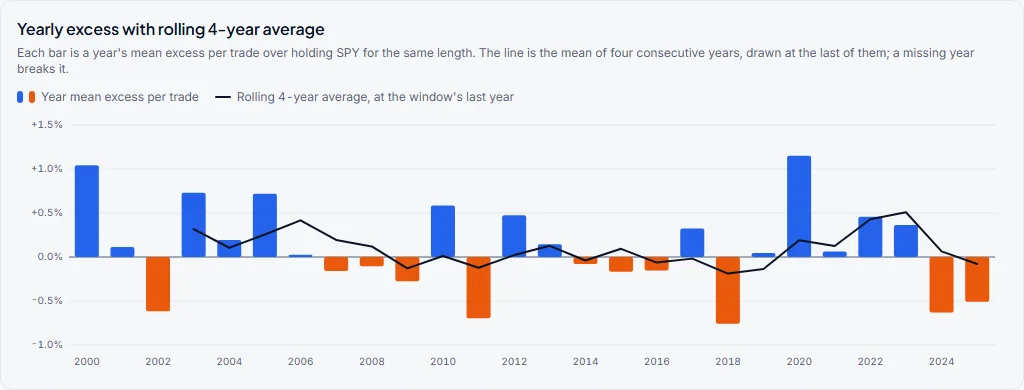
Two calendar claims. Two different results.
A positive historical return does not tell the whole story. See what remains after comparing it with ordinary holding.
How it works
Pick a symbol or type a calendar claim
Any of 1,456 US stocks and ETFs, or a date window, weekday or month you heard about.
See every year against holding
Each year beside holding the same symbol for the same number of sessions, so you can tell whether the calendar added something or the stock simply rose.
Follow what it did after the cutoff
Rules are found on prices through December 31, 2025. Every trade since Jan 1, 2026 is shown apart, on prices the rule never saw.
Entering in the next five sessions
Shortlisted rules whose next entry is near, strongest first. Each passed every filter:
- At least 15 years of history
- Beat holding in at least 80% of observed years
- Beat holding in both final research years: 2024 and 2025
- Average trade made money, gross
Excess / year is the average over the years of each year’s total excess over holding, gross. It is a sum, not compounded: not the growth of an account. Historical, hypothetical results before costs. These filters describe past consistency, not the probability of a future profit. Hypothetical performance notice.
Inside the platform
Discover an idea, test it, and understand the evidence. Follow a strategy, see its upcoming trades, and verify the result afterward.
Every calendar rule on every symbol, so you see which windows added something over holding before you open a chart.
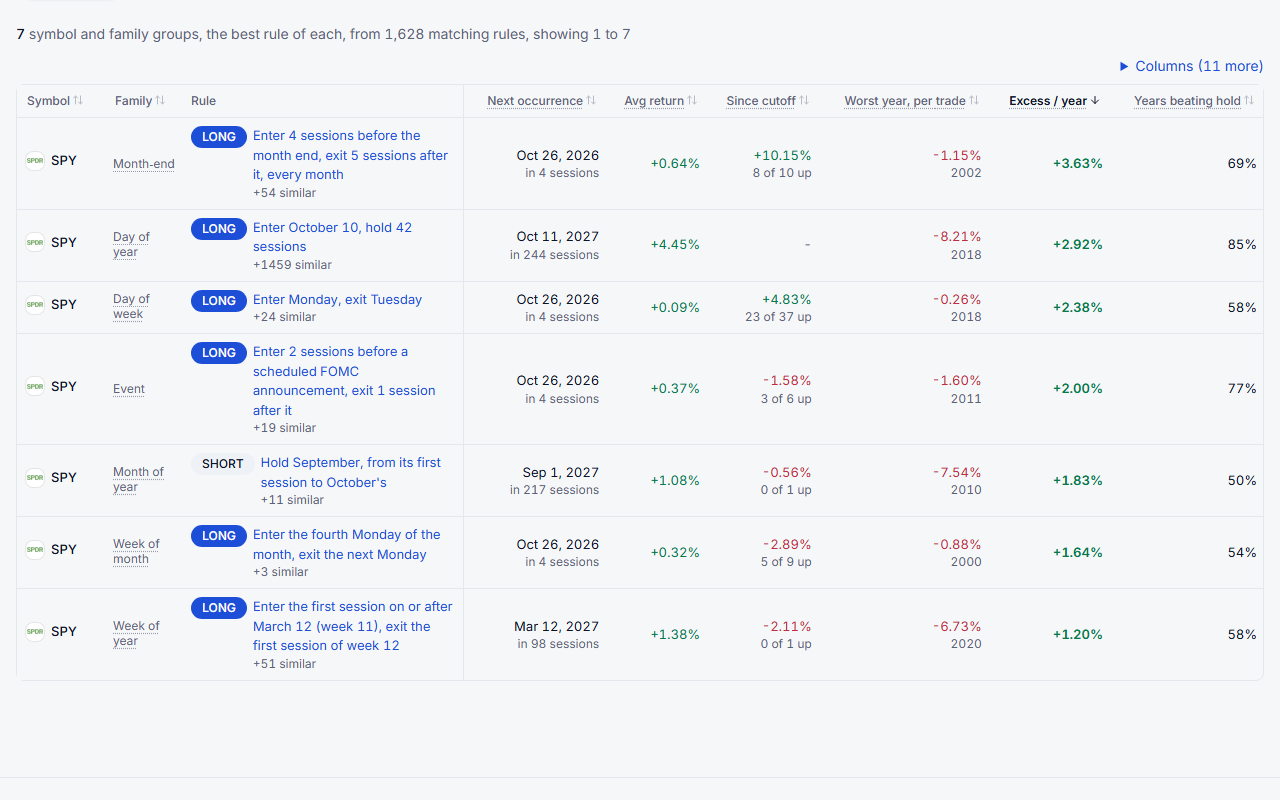
Every calendar rule on every symbol, so you see which windows added something over holding before you open a chart.
Snapshot of Oct 20, 2026. Hypothetical results through the research cutoff; post-cutoff results shown apart.Create my free account
Ask your AI app
Connect SeasonalEdge to Claude, ChatGPT, Gemini or your coding tool and ask in plain words, so you get the same scan, rules, strategies and track record you see here without leaving the app. It reads only, and you sign in once; there is no key to copy.
- Claude
- ChatGPT
- Gemini
Answers carry the same figures as the site: gross returns, computed on history through the research cutoff, with later results apart. Not a forecast and not advice. Membership required; client availability varies.
Membership
Free while membership opens. No card required. Accounts created now are offered the founding price first.
- The Scan of every symbol, so you see which calendar windows added something over holding before you open a chart.
- The exact entry and exit of every rule, with its year-by-year record, so you can judge the weak years yourself.
- Check for your own claims, so you can measure a date, weekday or month you heard about the same way as every rule in the Scan.
- Today and the strategies, so you know what enters at the next open and what each rule did since the cutoff.
- Exports for TradeStation, MultiCharts and TradingView, so you can run a rule on your own platform.
- Your AI app connected, so you can ask Claude, ChatGPT or Gemini in plain words and get the same figures.
Questions before you join
Is this investment advice or a trade alert service?
No. SeasonalEdge describes what calendar rules did on history, compared with holding the same symbol. It does not tell you what to buy or sell, and past seasonal behaviour may not repeat. Nothing here is investment advice.
Why are the figures gross?
Every return is before any trading cost, because costs differ from one trader to the next. Take your own round-trip cost off the gross figure per trade: when a round trip costs you more than the average trade made, the rule loses money.
What is the research cutoff?
Rules are found and sorted using prices through December 31, 2025 only. Everything after that date is kept apart and never used to choose a rule, so the results since Jan 1, 2026 show how each rule did on prices it never saw.
Where do the prices come from, and how fresh are they?
Daily prices from Alpha Vantage and index closes from Yahoo, refreshed after each session. The latest prices used are from November 2, 2026.
How is this different from a seasonality chart?
A seasonality chart shows a symbol’s average path or how often a window went up. On a stock that rose for years, almost every window looks good. SeasonalEdge compares each window with holding the same symbol for the same number of sessions, shows every year including the weak ones, and reports what each rule did after the cutoff, separately.
What does it cost, and do I need a card?
Membership is free while it opens, and signing up needs no card, only an email and a password. Accounts created now are offered the founding price first when billing opens. You can ask for your account to be deleted from the Account page.
Check a calendar claim before you trade it.
A free account shows every rule’s exact entry and exit, tests your own claims year by year against holding, and follows what each rule did since the cutoff.
Create my free accountFree while membership opens. No card required. Accounts created now are offered the founding price first.
Not ready for an account? Get the next study by email
One calendar claim, tested against ordinary holding. Free, no account needed.