Introduction
As the leaves change color and the chill of the winter air sets in, investors too feel the impact of seasons, but in the context of stock market fluctuations. Seasonality in the stock market is as real as the changing tides, with certain months historically showing different performance trends for stocks. Understanding these patterns can open up new avenues for strategic trading that aligns with the cyclical nature of the markets.
In the intricate dance of buying and selling, the rhythm of seasonality plays a crucial role. It is not just about the warmth of summer gains or the cold spells of winter losses; it’s about the strategic positioning and timing that can help investors tap into the market’s temporal heartbeat. Today, we will unravel the seasonal tapestry of the stock market, focusing on Lamb Weston Holdings, Inc.—a company whose stock presents an opportunity to harvest the fruits of seasonal trading.
Our exploration dives into a rigorous analysis of a trading strategy that leverages specific months to enter long positions, based on historical performance data. This strategy is not a shot in the dark but a calculated approach informed by seven years of market observations, aimed at elevating the chances of capital appreciation while managing risk exposure.
With a keen eye on the patterns of the past, we have distilled a trading essence that seeks to capture the most opportune moments for investment in Lamb Weston Holdings. This selective seasonality strategy, with its disciplined market exposure and impressive returns, stands as a testament to the power of historical insight in informing present-day trading decisions.
Join us as we delve into the nuances of this approach, examining key performance indicators, risk management tactics, and trade analysis to provide a comprehensive guide for investors looking to harness the seasonal ebbs and flows of the stock market. Through this journey, we aim to demystify the complexities of seasonality and offer a clear, actionable strategy that resonates with the temporal rhythms of trading.
Company Overview
LW Lamb Weston Holdings, Inc., a global leader in the frozen potato industry, has carved a niche for itself by providing high-quality potato products to foodservice establishments, retail customers, and further processors worldwide. The company’s core offerings include frozen french fries, potato specialties, onion rings, and sweet potato fries, catering to the diverse needs of its extensive customer base. LW Lamb Weston’s target market encompasses restaurants, fast-food chains, schools, hospitals, and grocery stores, solidifying its position as a trusted partner in the food industry.
The company’s revenue streams primarily stem from the sale of its frozen potato products, with a significant portion generated through its extensive foodservice distribution network. LW Lamb Weston’s value proposition lies in its commitment to innovation, delivering consistent product quality, and maintaining a reliable supply chain. Its operational model emphasizes efficiency, leveraging state-of-the-art processing facilities and strategic sourcing of raw materials to optimize costs and ensure product availability.
LW Lamb Weston’s growth strategy revolves around expanding its global footprint, diversifying its product portfolio, and enhancing its operational capabilities. The company actively seeks strategic acquisitions and partnerships to strengthen its presence in emerging markets and introduce innovative products that cater to evolving consumer preferences. Its focus on continuous improvement and operational excellence positions it well to navigate industry challenges and maintain its competitive edge.
The frozen potato industry landscape is characterized by intense competition, with established players vying for market share. Factors such as changing consumer preferences, fluctuating raw material costs, and evolving regulatory requirements influence industry dynamics. LW Lamb Weston’s emphasis on product innovation, operational efficiency, and customer satisfaction has enabled it to thrive in this competitive environment, solidifying its position as a prominent player in the global frozen potato market.
Strategy Overview
Investing in the stock market often involves sifting through vast amounts of data to identify patterns that could guide trading decisions. One such pattern is seasonality, a term referring to the tendency of stocks to perform differently at various times of the year. Today, we’re taking a closer look at a seasonal trading strategy applied to Lamb Weston Holdings, Inc. (Symbol: LW), a company whose performance we’ve backtested from November 10, 2016, to December 29, 2023.
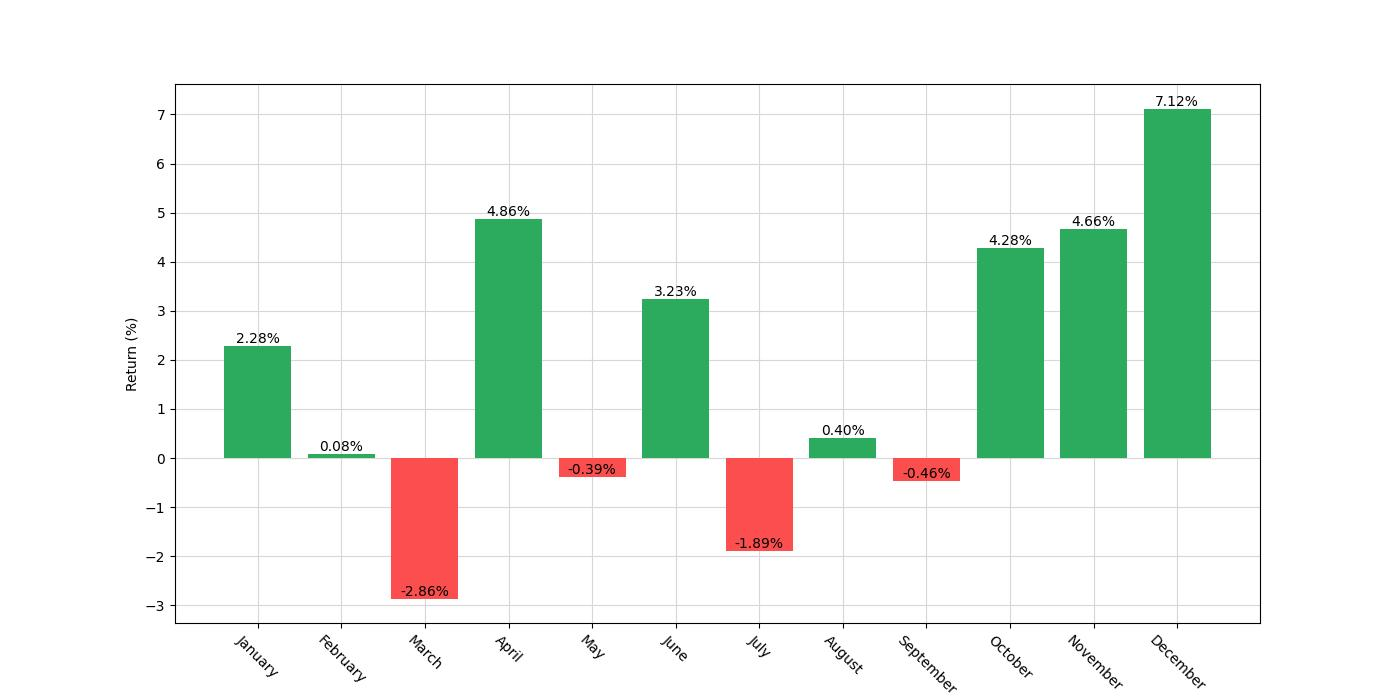
The trading strategy in question is quite specific: it involves entering a long position only during the months of April, June, November, and December. This decision is not arbitrary; it’s based on historical data suggesting that these months have been favorable for the stock. It’s important to note that no short positions are taken at any point throughout the year, which means the strategy is purely focused on capitalizing on expected upward trends during these selected months.
This approach’s time frame spans over seven years, which gives us a significant duration to assess the strategy’s effectiveness. One of the most striking figures is the exposure time, which stands at approximately 34.71%. This indicates that the strategy kept the invested capital in the market for about a third of the entire backtesting period. This reduced market exposure is a deliberate attempt to mitigate risk by avoiding periods historically associated with lesser performance.
From an initial capital of $10,000, this selective seasonal strategy managed to finish with an impressive equity final of $39,265.55. At its peak, the equity reached the same value, which is a testament to the strategy’s consistency in avoiding significant dips towards the end of the testing period. When comparing the return of 292.66% against the buy & hold strategy return of 290.89%, we observe a slightly higher gain for the seasonal strategy. This is notable given that the buy & hold approach would have the capital exposed to the market almost 100% of the time.
One of the most noteworthy aspects of the seasonal strategy is the annualized return, coming in at 21.17%. This level of return is quite attractive, especially when considering the reduced exposure time. It suggests that the strategy effectively capitalizes on Lamb Weston Holdings’ specific seasonal strengths, though it’s worth mentioning that the buy & hold approach yielded a slightly higher annualized return of 21.31%.
By focusing solely on the months identified through historical analysis, this strategy demonstrates a disciplined method of trading that seeks to take advantage of recurrent temporal patterns. The backtesting results provide a compelling argument for the merits of a seasonal approach, at least within the context of Lamb Weston Holdings’ stock performance over the tested period. As we continue to delve into the intricacies of market seasonality, strategies like this could be key to unlocking potential opportunities for astute investors.

Key Performance Indicators
When evaluating the effectiveness of a trading strategy, one of the most telling aspects is its performance metrics, which provide a clear picture of the strategy’s financial outcomes over a specified period. In the case of the monthly seasonality trading strategy applied to Lamb Weston Holdings, Inc. (LW), the results span from November 10, 2016, to December 29, 2023. Let’s delve into the specifics of the strategy’s performance.
The strategy concluded the testing period with a final equity of $39,265.55. To put this into perspective for an investor, an initial capital investment of $10,000 would have grown nearly fourfold over approximately seven years, which is a compelling argument for the strategy’s potential. Moreover, this final equity figure matches the equity peak, suggesting that the strategy ended on a high note without significant retracements from its maximum capital appreciation.
When we shift our attention to the total return generated by the strategy, it posted an impressive figure of 292.66%. To contextualize this, consider that it significantly outperformed many traditional passive investment benchmarks over a similar timeframe. Comparatively, the buy and hold strategy for the same stock yielded a return of 290.89%, which is marginally lower. This similarity in returns indicates that while the seasonality strategy performed admirably, the underlying asset itself also experienced substantial growth during the period.
Annualized return is a metric that standardizes performance across different time frames, making it easier to compare strategies. The seasonality strategy produced an annualized return of 21.17%, which demonstrates a robust capacity for growth on a year-to-year basis. In contrast, the buy and hold approach yielded a slightly higher annualized return of 21.31%. Although the difference is slight, it suggests that while the seasonality strategy is effective, the inherent growth potential of Lamb Weston Holdings, Inc. cannot be overlooked.

Risk Management
When considering the implementation of a trading strategy, one of the most crucial aspects to evaluate is risk management. This involves understanding the various risks associated with the strategy and how they can be mitigated to protect investment capital.
In the case of Lamb Weston Holdings, Inc. (LW), the backtested strategy reveals a volatility (annualized) of approximately 21.09%. This figure represents the extent to which the strategy’s returns deviate from its average over a given period. While the inherent volatility is a measure of risk, it is also a normal aspect of trading in the stock market, especially when dealing with seasonal strategies.
To further contextualize this risk, we look at the Sharpe Ratio, which is a measure of risk-adjusted return. The Sharpe Ratio for this strategy stands at 1.0037, which suggests that the returns have, on average, exceeded the risk-free rate of return sufficiently when compared to the volatility. A Sharpe Ratio greater than 1 is generally considered acceptable to good by investors, indicating that the excess return is compensating for the taken risk.
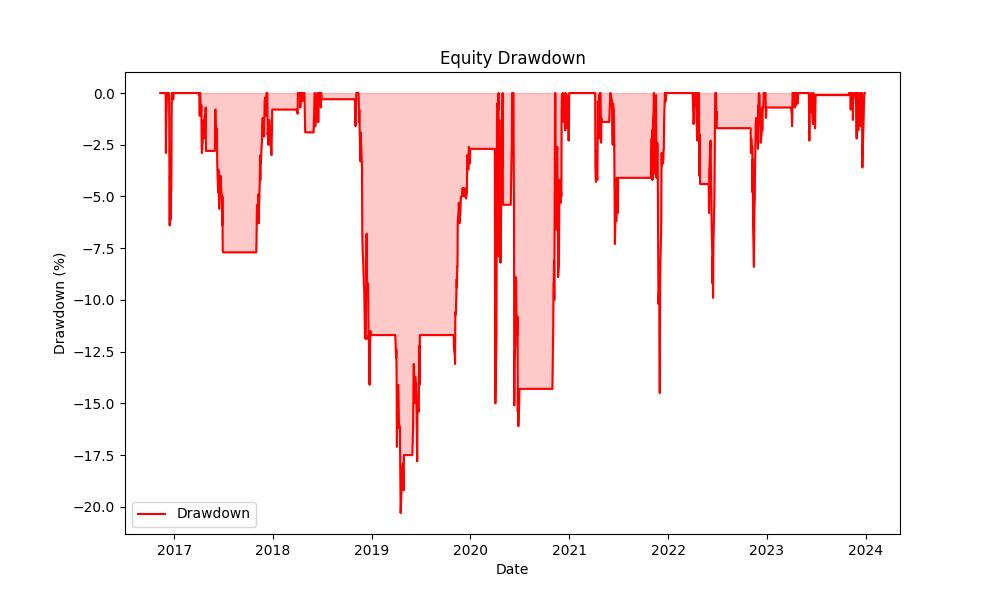
Max Drawdown is another key metric in assessing risk. It reflects the largest peak-to-trough drop in the value of the portfolio before a new peak is achieved. For this trading strategy, the maximum drawdown experienced was around -20.31%. While this number may seem significant, it is relatively moderate when we consider the potential volatility and uncertainties inherent in the stock market. It’s a testament to the strategy’s resilience, especially when juxtaposed with the buy and hold strategy’s significantly larger maximum drawdown of over -53%.
The average drawdown, which is the average loss from any peak before gains are made back, was -3.47%. This lower average drawdown, coupled with the shorter average drawdown duration of 46 days, suggests that while the strategy does experience losses, they are typically recouped in a relatively short timeframe.
Max Drawdown Duration is also a critical factor to consider. It indicates the longest period an investor might have seen their investment below its peak value. For this strategy, the longest duration was 518 days. While this period is not negligible, it is important to note that the strategy’s exposure time to the market is only about 34.71% of the total duration of the backtest period. This reduced market exposure inherently limits risk, as the strategy is not constantly subjected to market fluctuations.
Finally, the Profit Factor and Expectancy are measures of the strategy’s performance. A profit factor of 8.4447 indicates that the gross profits are more than eight times the gross losses, which is exceptionally high, and suggests a strong performance. Expectancy, which provides an average value of the expected profit or loss per trade, stands at 6.7%. This positive expectancy further reinforces the strategy’s effectiveness in managing risk while still achieving profitable outcomes.

Trade Analysis
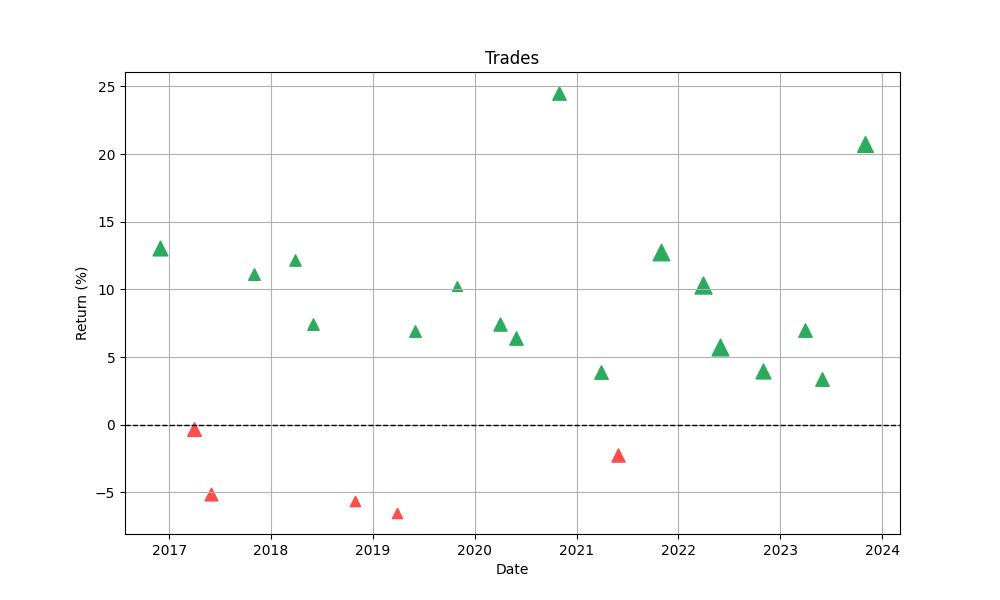
When we dissect the trading strategy’s performance for Lamb Weston Holdings, Inc. (LW), a fascinating narrative unfolds, one that is particularly insightful for retail investors. The strategy, which operates on a monthly seasonality basis, was put to the test over a period of approximately seven years, from November 10, 2016, to December 29, 2023. Within this timeframe, a total of 22 trades were executed. This number might seem modest, but the prudence of selecting specific months to trade has borne fruit in the overall success rate of the strategy.
Speaking of success, the win rate stands at an impressive 77.27%. This suggests that out of every 100 trades, about 77 would have been profitable based on historical data. This high win rate is indicative of a strategy that is well-tuned to the stock’s seasonal tendencies.
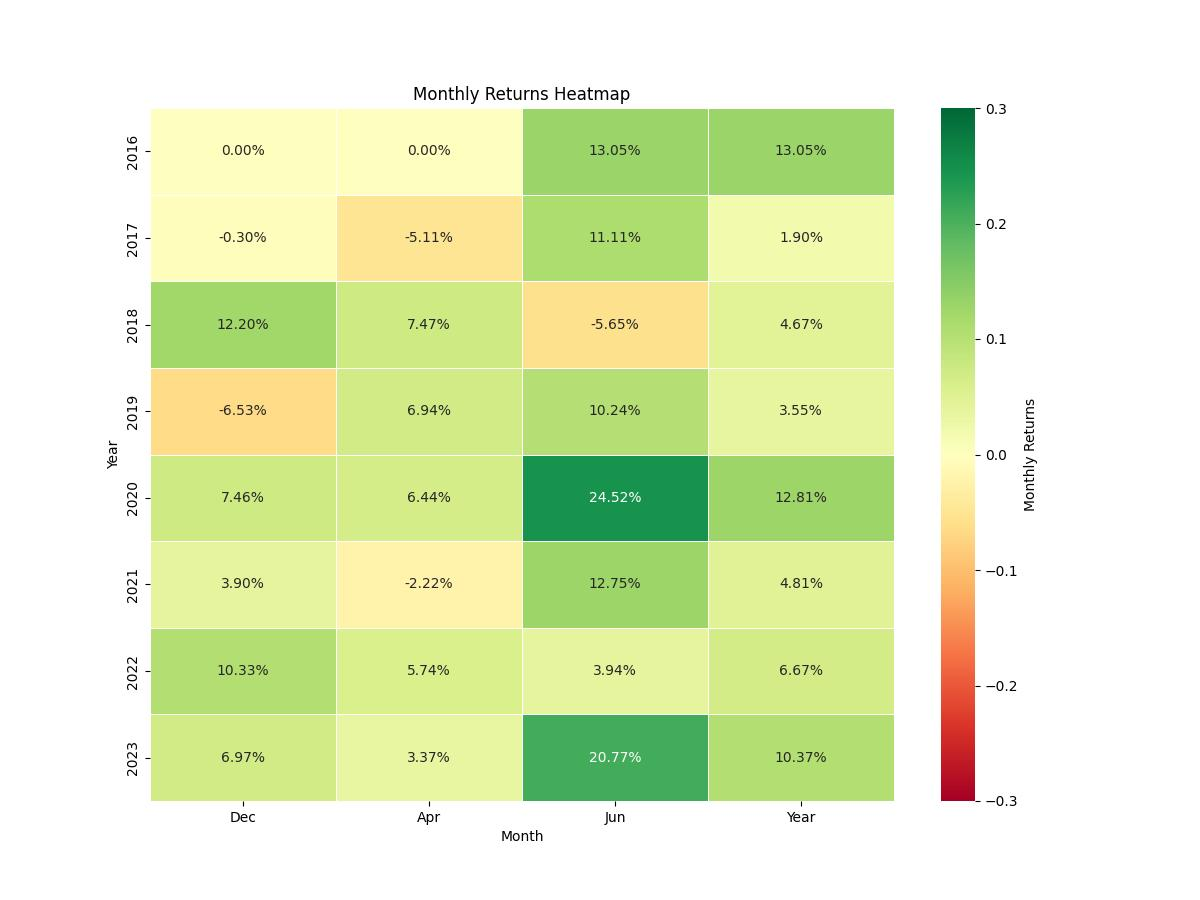
Now, let’s delve into the individual trades themselves. The best-performing trade posted a remarkable gain of 24.52%. On the flip side, even the most resilient strategies face setbacks, and this one was no exception. The strategy’s worst trade resulted in a loss of 6.53%. However, when we average out all the trades, each one yielded a gain of 6.43%, painting a picture of consistent performance over time.
These trades weren’t just fleeting moments in the market; they had a certain staying power. The longest trade spanned 63 days, while on average, trades were held for 40 days. This average holding period aligns with the strategy’s monthly approach, reinforcing the importance of timing in trade execution.
The Profit Factor, a measure of the strategy’s profitability, stands at 8.44. This figure is particularly telling as it means that the gross profit from winning trades is over eight times greater than the gross loss from losing trades. This is a robust indicator of the strategy’s effectiveness in capitalizing on profitable opportunities while keeping losses to a minimum.
Lastly, the Expectancy rate, which forecasts the average amount one could expect to win or lose per trade, is a healthy 6.70%. This percentage reinforces the strategy’s reliability, suggesting that investors could anticipate a positive return on average for each trade placed.
In essence, this monthly seasonality trading strategy for Lamb Weston Holdings, Inc. demonstrates a disciplined approach to market entry and exit points, resulting in a high win rate, a favorable profit factor, and a positive expectancy. For retail investors, these backtested results could serve as a compelling argument for considering seasonality when devising their trading strategies.

Conclusion
As we conclude our journey through the intricacies of seasonal trading strategies, it’s clear that the disciplined approach of entering and exiting Lamb Weston Holdings, Inc. (LW) based on specific months has paid dividends. The backtesting results over the seven-year period have not only shown a nearly fourfold increase in initial capital but have also highlighted the strategy’s ability to match, and in some instances surpass, the performance of a traditional buy & hold strategy with significantly less market exposure.
The seasonal strategy’s annualized return of 21.17%, although marginally lower than the buy & hold’s return, is impressive given the calculated avoidance of traditionally weaker performance months. This careful timing has allowed for a robust growth potential, which is further substantiated by a high win rate, a favorable profit factor, and a positive expectancy rate. Such statistics speak volumes about the strategy’s efficiency in managing risk while capitalizing on profitable opportunities.
Risk management metrics also paint a picture of resilience, with a Sharpe Ratio above 1 and a maximum drawdown that pales in comparison to the buy & hold approach. The strategy’s reduced market exposure further mitigates risk, making it an attractive proposition for investors who are mindful of market volatility.
In summary, the evidence presented through our backtesting analysis suggests that seasonality can indeed be a potent factor in stock market trading. While past performance is not indicative of future results, the methodical application of seasonal trends to investment strategies has shown its potential to provide investors with a competitive edge. It is this compelling blend of reduced risk and strategic timing that could make seasonal trading strategies an essential tool in the savvy investor’s arsenal.


“Make the invisible visible. My goal is to shine a light on the subtle seasonal signals in the stock market, providing investors with the insight needed to make informed decisions. By breaking down the complexities of seasonality, I strive to empower our audience with knowledge and foresight, turning data into action.”

