


Introduction
As the seasons turn, so too can the fortunes of the stock market, presenting both challenges and opportunities for the astute investor. The complex tapestry of seasonal trends within the market often conceals patterns that, once deciphered, can be harnessed to craft strategies with the potential to outperform standard investment approaches. In the realm of real estate investment trusts, American Homes 4 Rent (AMH) stands as a prime example of a security whose historical performance has demonstrated a notable seasonality. This blog post will unveil a trading strategy that has not only weathered the test of time, from August 2013 through December 2023, but also emerged as a beacon for investors seeking to navigate the cyclical waves of the stock market with precision and foresight.
Embarking on a journey through the nuances of this monthly seasonality trading strategy, we will explore how it has transformed an initial investment into a sum that far outstrips the gains of a passive approach. The strategy’s disciplined adherence to seasonal patterns aligns with the ebb and flow of the housing market and investor sentiment, key drivers that can sway the performance of AMH shares. Through a detailed analysis of performance indicators, risk metrics, and individual trade outcomes, we will dissect the strategy’s robustness and its ability to deliver compelling returns while managing market exposure and risk.
Join us as we delve into the intricacies of this seasonal strategy, where timing is not just a factor—it’s the foundation upon which successful investment decisions are built. Whether you’re a seasoned trader or new to the intricacies of the stock market, our step-by-step breakdown of this approach will provide valuable insights into the art of capitalizing on seasonal stock market trends.
Company Overview
AMH (American Homes 4 Rent) is a prominent real estate investment trust (REIT) specializing in single-family rental homes across the United States. Headquartered in Agoura Hills, California, the company focuses on acquiring, renovating, leasing, and managing a portfolio of single-family homes, catering primarily to families and individuals seeking a suburban lifestyle. Through its vast network of properties, AMH offers diverse rental options and strives to provide a high-quality living experience for its tenants. The company generates revenue through rental income, property management fees, and potential appreciation in the value of its properties. AMH’s operational model emphasizes efficient property management, tenant screening, and maintenance services, aiming to maximize occupancy rates and rental yield. Growth strategies involve expanding its rental home portfolio through strategic acquisitions and property development, diversifying its geographic presence, and implementing technology-driven solutions to enhance operational efficiency. Operating in a competitive industry, AMH distinguishes itself by offering a compelling value proposition, including flexible lease terms, modern amenities, and responsive property management, targeting a large and growing market of renters seeking single-family homes.
Strategy Overview
Investing in the stock market can often feel like navigating through a vast ocean with ever-changing currents. Just as sailors use the stars to guide their journey, savvy investors can employ seasonal trading patterns to inform their decisions. American Homes 4 Rent (AMH), a real estate investment trust specializing in single-family rental homes, provides a compelling case study for a monthly seasonality trading strategy. This strategy, which has been backtested from August 1, 2013, to December 29, 2023, shines a spotlight on the potential of leveraging calendar-based patterns to enhance investment returns.
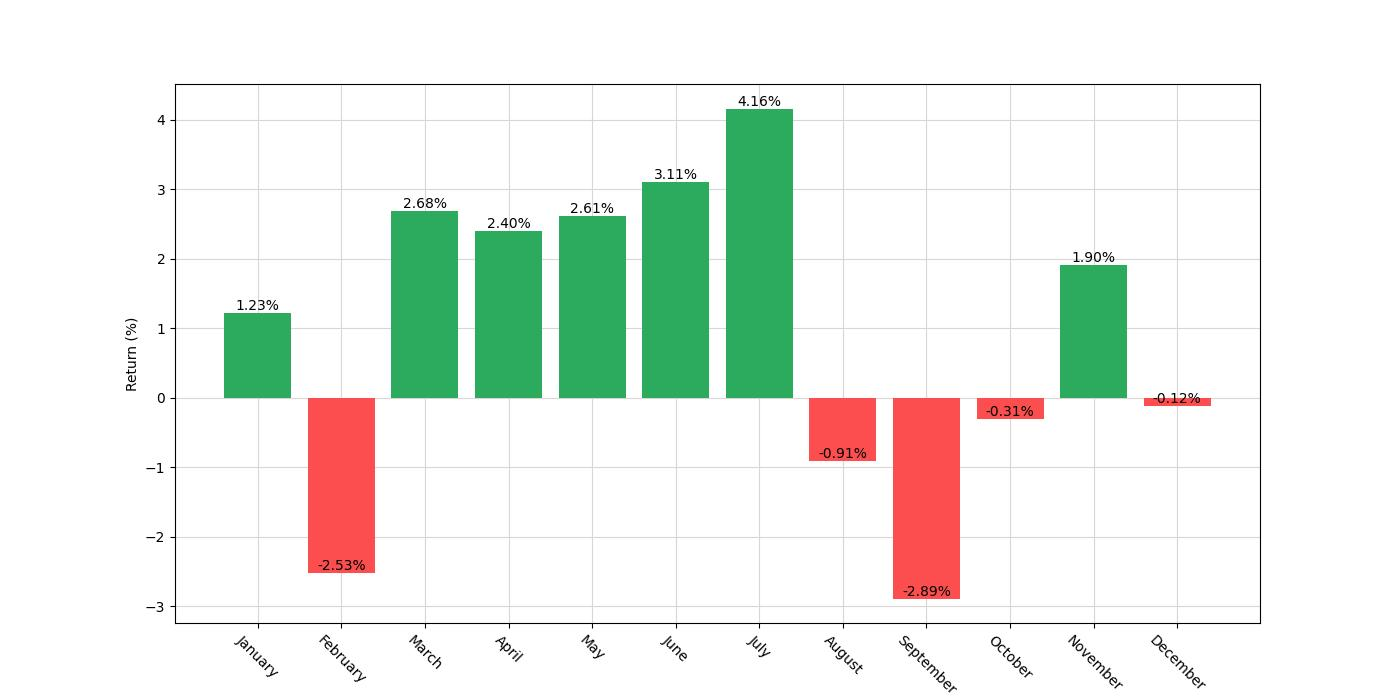
Over the course of 3,802 days, this strategy has dictated that investors take a long position—buying with the expectation that the stock price will rise—in AMH during March, April, June, and July. Conversely, the strategy suggests short positions—selling shares with the intention of buying them back at a lower price—in February, August, and September. This rhythmic approach to trading aligns with the cyclical nature of the housing market and investor sentiment, often tied to seasonal factors like construction cycles, moving trends, and tax implications.
During the backtesting period, this strategy was in play for approximately 57.55% of the time, suggesting a moderate level of market exposure. In other words, for a little over half the time, the strategy was actively engaging the market, either in a long or short position, allowing investors to potentially capitalize on perceived seasonal trends while also granting periods of rest, reducing exposure during historically less opportune months.
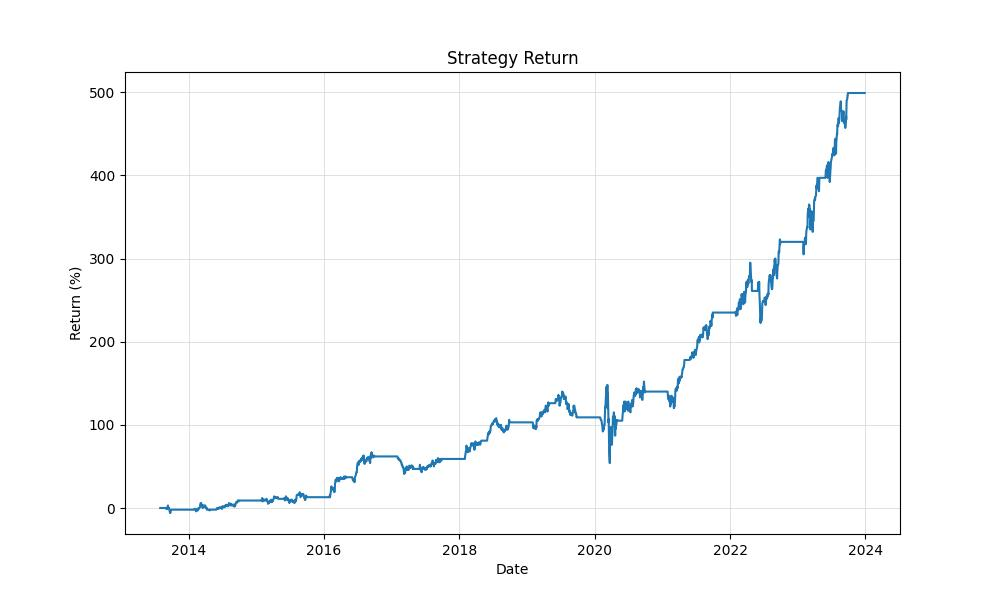
Starting with an initial capital of $10,000, the seasonal strategy demonstrated its potential by growing the equity to a final amount of $59,893.41, reaching the same peak value. When juxtaposed with a traditional buy and hold approach, the seasonal strategy’s return was a staggering 498.93%, dwarfing the buy and hold’s return of 162.14% over the same period. This marked outperformance highlights the added value of strategic entry and exit points based on historical monthly performance.
On an annualized basis, the return of the seasonal strategy stood at 18.77%, evidencing the power of compounding gains year-over-year. It’s worth noting that this return was achieved with a market exposure of less than 60%, suggesting that the strategy was not only profitable but also efficient in its market engagement.
Understanding the seasonal trading pattern’s efficacy requires a closer look at how it compares to a passive investment in American Homes 4 Rent over the same period. The buy and hold strategy, with nearly continuous market exposure, yielded an annualized return of 9.65%. This contrast in annualized returns underscores the potential benefit of a tailored, season-based trading strategy that actively manages exposure to AMH shares based on historical monthly performance data.
In sum, the backtesting results paint a picture of a trading strategy that not only respects the natural ebb and flow of the market but also capitalizes on it. By aligning trades with historically favorable months, this seasonality-based approach to trading American Homes 4 Rent shares has demonstrated the potential to significantly outperform a passive, buy and hold strategy over a multi-year period. The data-driven nature of this strategy offers a compelling argument for retail investors to consider the timing of their trades as a key component of their investment decisions.
Key Performance Indicators
Investing in the stock market is often about timing, and this holds true when we consider the performance of American Homes 4 Rent (AMH) under a specific seasonal trading strategy. Over a span of roughly a decade, from August 2013 to December 2023, an intriguing pattern emerges when we examine the results of a monthly seasonality strategy that has been backtested without accounting for commissions or slippage.
The essence of this strategy is straightforward: we go long on AMH during the months of March, April, June, and July, and take short positions in February, August, and September. This approach capitalizes on historical trends observed in the stock’s performance during these specific months.
So, how did this strategy fare? The initial investment of $10,000 blossomed to an impressive $59,893.41, a near six-fold increase, peaking at the same value. This represents a staggering return of 498.93%, dwarfing the return from a conventional buy-and-hold strategy which stood at 162.14%. The annualized return from the seasonal strategy is 18.77%, indicating a strong performance year over year.
But returns alone don’t tell the whole story. The annualized volatility, a measure of the risk or uncertainty associated with the returns of the investment, was recorded at 21.37%. This is a critical figure as it helps investors understand the potential fluctuations they might experience. Despite the inherent risks of the stock market, the strategy’s Sharpe Ratio, which is used to understand the return of an investment compared to its risk, was a respectable 0.878. This suggests that the excess return justifies the volatility endured by the investor.
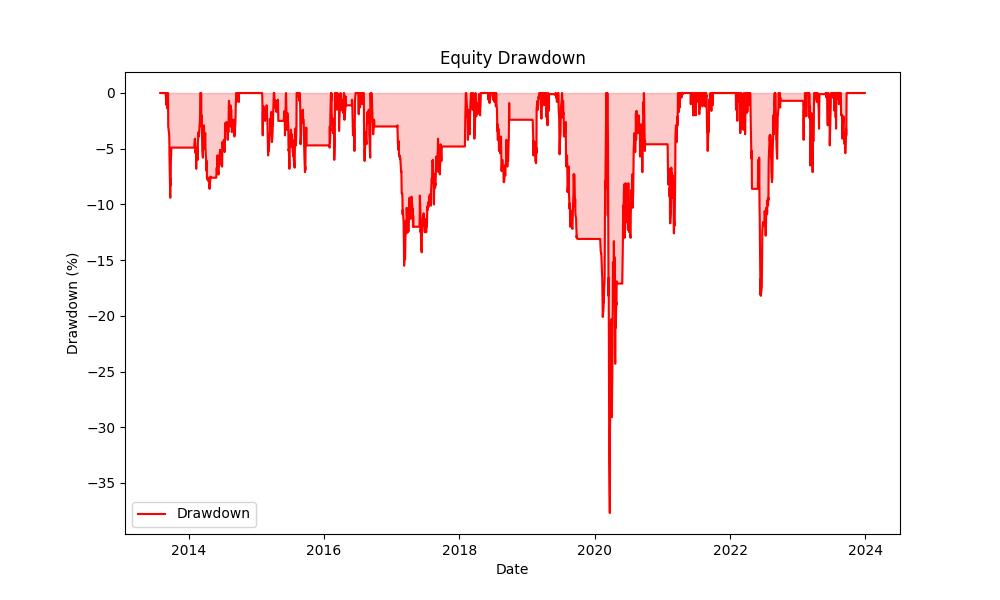
In terms of drawdown, the strategy experienced its largest peak-to-trough decline at 37.67%. While this figure may seem daunting, it’s important to remember that drawdowns are a normal part of trading and investing. The average drawdown was much lower, at 2.87%, and the average duration of these drawdowns was just 29 days. The maximum duration for a drawdown was 509 days, indicating that while the strategy could experience periods of decline, these periods were temporary and recoverable within the context of the strategy’s overall performance.
When we talk about the resilience of an investment strategy, the Calmar Ratio is a key figure, which relates the annualized return to the maximum drawdown. The Calmar Ratio for this strategy sits at 0.498, signaling that the annual return has been about half as much as the maximum drawdown over the period. While this number could be higher, it still indicates a level of robustness in the trading strategy, especially when juxtaposed with the buy-and-hold approach.
In the dynamic world of stock trading, these figures paint a vivid picture of the potential benefits of a well-researched seasonal strategy. The numbers demonstrate that, for AMH, strategic entry and exit points aligned with specific months can significantly impact investment outcomes, highlighting the importance of timing and historical patterns in the pursuit of stock market gains.
Risk Management
When evaluating the performance of any trading strategy, it’s crucial to look beyond mere returns and delve into the risks that were taken to achieve those returns. In the case of the seasonality trading strategy applied to American Homes 4 Rent (AMH), we have some telling risk metrics that deserve our attention.
Firstly, let’s consider the annualized volatility, which came in at 21.37%. This is a measure of the variability of the strategy’s returns over time and gives us an indication of the overall risk profile. Compared to the annualized volatility of the buy-and-hold approach at 25.39%, this strategy appears to have experienced slightly less fluctuation in returns, suggesting a potentially smoother investment ride.
However, the real litmus test for any investor is how much pain they’re willing to endure, which brings us to the Sharpe Ratio. At 0.878, this strategy’s Sharpe Ratio, which measures the excess return per unit of risk, suggests that the risk taken on has been fairly compensated when compared to a risk-free investment. In contrast, the buy-and-hold strategy’s Sharpe Ratio is lower at 0.380, indicating less favorable risk-adjusted returns.
The Max. Drawdown is another eye-opening figure; it stands at -37.67% for our trading strategy. This metric shows us the largest peak-to-trough decline in the strategy’s value, and it’s a critical number as it tests the mettle of investors; will they stay the course or bail out after such a loss? The buy-and-hold strategy experienced a slightly higher Max. Drawdown at -38.39%, marginally worse but still in the same ballpark.
Zooming in further, we see that the average drawdown was -2.87%, while the average length of these drawdowns was 29 days. This suggests that while the strategy did experience declines, they were relatively short-lived. This contrasts with the buy-and-hold approach, which saw average drawdowns of -3.59% lasting 42 days on average.
The Max. Drawdown Duration, which represents how long it took to recover from the largest loss, was 509 days for our trading strategy. This is a significant period, but it’s worth noting that the buy-and-hold strategy faced an even longer road to recovery with a Max. Drawdown Duration of 728 days.
Understanding these risk metrics is vital for investors. It’s not just about the returns you can make, but also about the stomach for risk you need to have to achieve those returns. By analyzing the volatility, drawdowns, and recovery periods, investors can make more informed decisions about whether a particular trading strategy aligns with their risk tolerance and investment goals.
Trade Analysis
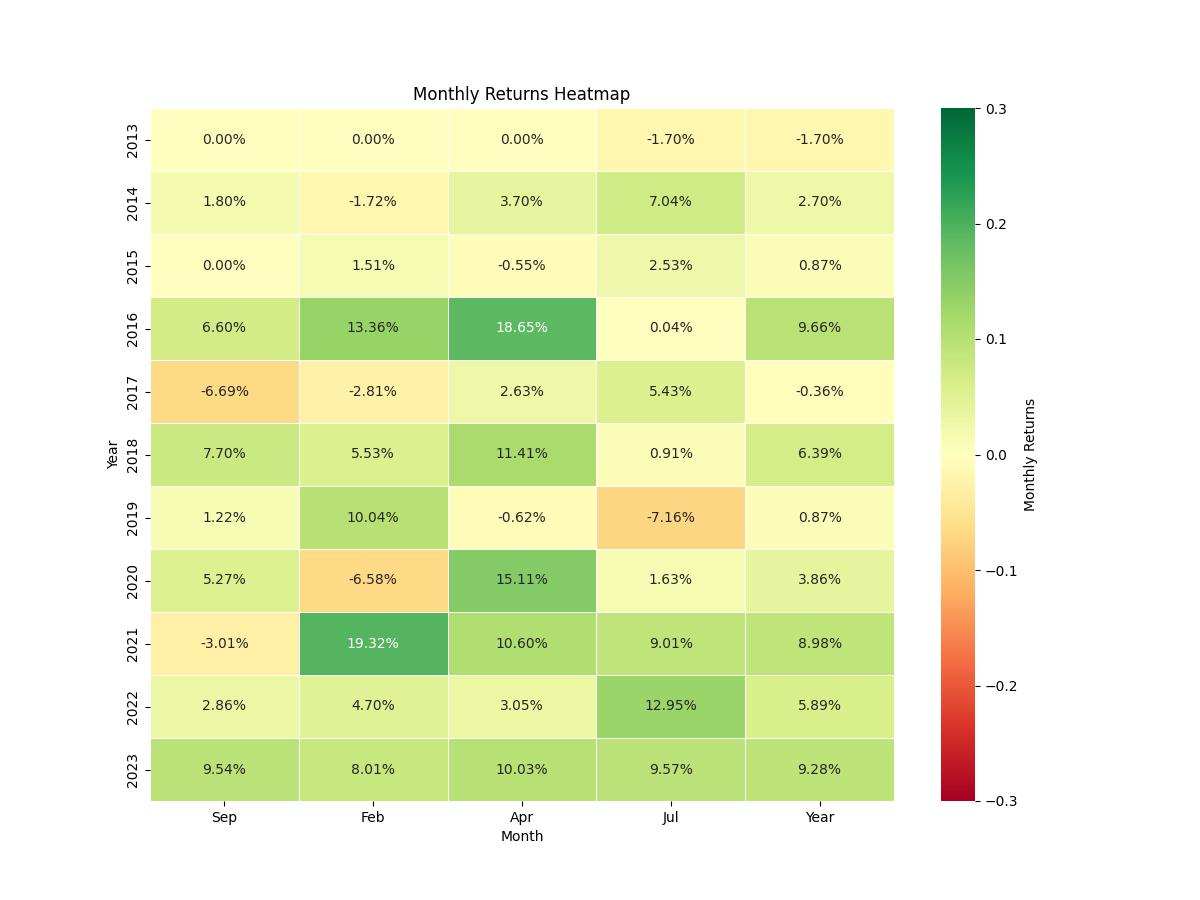
Delving into the trade analysis for American Homes 4 Rent’s (AMH) seasonal trading strategy, we unearth some compelling insights that can guide retail investors interested in the temporal dynamics of stock trading. With a backtesting period stretching from August 2013 to December 2023, the strategy under scrutiny involves initiating long positions during the months of March, April, June, and July, and short positions during February, August, and September.
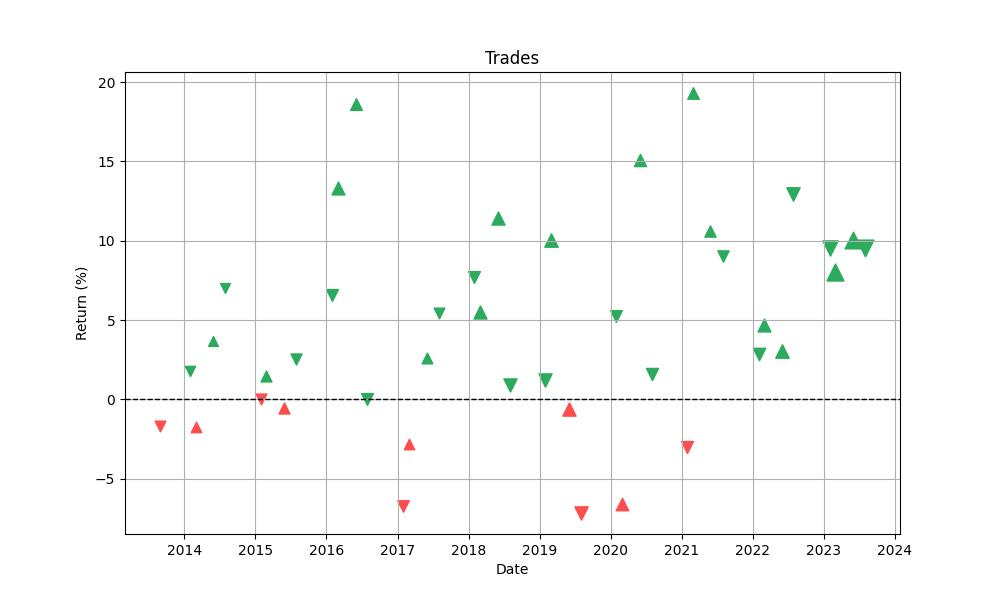
Over the course of these ten years, the strategy has executed a total of 41 trades. A standout figure that immediately captures attention is the high win rate of approximately 75.61%. This indicates that three out of four trades, on average, were profitable—an encouraging statistic for investors looking for consistency in trade outcomes.
The most profitable trade within this period yielded a staggering 19.32% return, showcasing the potential of this strategy to capitalize on significant market movements. On the flip side, even the least successful trade, which resulted in a loss of 7.16%, underscores the importance of risk management in seasonal trading.
The average return per trade was around 4.46%. This average is a testament to the strategy’s effectiveness in generating consistent returns over multiple trades, rather than relying on outliers. Moreover, the average trade duration was 53 days, with the longest trade lasting 63 days. This relatively short holding period for each trade implies that the strategy is dynamic, enabling investors to potentially reduce exposure to long-term market risks.
A critical factor contributing to the success of the strategy is the profit factor, which stands at an impressive 7.19. This ratio of gross profits to gross losses signifies that for every dollar lost, over seven dollars were gained. It’s a strong indicator of the profitability of the trading strategy.
Expectancy, which measures the average expected return per trade, sits at 4.66%. This figure is particularly useful for investors as it provides a straightforward metric to gauge what they might expect to earn on average from each trade initiated under this strategy.
Lastly, the System Quality Number (SQN), a metric used to evaluate the strength and reliability of a trading system, is 4.40 for this strategy. A higher SQN indicates a more reliable and robust system, and in this case, the figure suggests that the seasonal trading strategy for AMH is quite solid.
Conclusion
In conclusion, the exploration of American Homes 4 Rent’s seasonality trading strategy over a decade has revealed a robust approach that can potentially offer investors an edge. By intelligently leveraging the cyclical nature of the housing market and historical stock performance, this seasonal strategy has proven to be more than just an academic exercise; it has demonstrated the capability to deliver substantial returns with controlled risk.
The success of this strategy is not solely based on the impressive 498.93% return it achieved but also on the strategic management of market exposure and the consistent outperformance of a passive buy-and-hold approach. With an annualized return of 18.77% and a Sharpe Ratio that indicates a satisfactory risk-adjusted return, investors are given a compelling reason to consider seasonality in their trading decisions.
The strategy’s win rate, profit factor, and other key performance indicators provide a reassuring picture of its effectiveness. However, it’s essential for investors to understand the associated risks and the resilience required to navigate through the inevitable market drawdowns. The drawdown statistics, including an average drawdown of -2.87% and a Max. Drawdown Duration of 509 days, emphasize the necessity of a strong risk tolerance and a commitment to the strategy.
The trade analysis further solidifies the strategy’s credibility, highlighting a win rate of 75.61% and an average return per trade of 4.46%. The profit factor of 7.19 and an SQN of 4.40 underline the strategy’s profitability and reliability.
Investors seeking to optimize their stock market participation could find valuable insights within this seasonal trading strategy. While past performance is not indicative of future results, the data-driven approach discussed in this blog post offers a detailed blueprint for a methodical, disciplined investment strategy that aligns with the seasonal ebb and flow of the market. As with any investment strategy, due diligence, ongoing analysis, and adaptation to changing market conditions are paramount to success.

“Make the invisible visible. My goal is to shine a light on the subtle seasonal signals in the stock market, providing investors with the insight needed to make informed decisions. By breaking down the complexities of seasonality, I strive to empower our audience with knowledge and foresight, turning data into action.”