

Introduction
As the leaves change with the seasons, so too do the dynamics of the stock market ebb and flow with a certain rhythmic predictability. In the intricate dance of investment, timing is a partner that, when understood and harnessed, can lead to a performance both graceful and profitable. For investors intrigued by the concept of seasonality in stock trading, this guide serves as your choreographer, breaking down complex patterns into a series of steps that can be followed with confidence and finesse.
In the ever-changing tapestry of the financial markets, Synchrony Financial stands out as an interesting case study. The company, deeply rooted in consumer financial services, presents a unique opportunity to deploy a trading strategy that’s in sync with the seasons. By distilling historical performance data into actionable insights, we offer a glimpse into a methodology that doesn’t just follow the market trends but anticipates them, providing investors with a strategic edge.
This piece is not about the random walk theory or the efficient market hypothesis; it’s about how investors can potentially improve their performance by recognizing and capitalizing on the patterns that historically repeat themselves within specific time frames. We present a practical exploration of a backtested monthly seasonality trading strategy tailored for Synchrony Financial, highlighting its potential to outperform traditional investment approaches.
Join us as we unravel the intricacies of this strategy, demonstrating how a disciplined trading schedule based on historical monthly trends can lead to substantial returns. We’ll illustrate the strategic entry and exit points, the potential risks and rewards, and ultimately, the compelling evidence that suggests timing, indeed, may be everything in the pursuit of investment success. Whether you’re a seasoned investor or new to the game, this guide aims to enhance your understanding of how seasonal factors can be integrated into your trading repertoire, equipping you with the knowledge to potentially reap the benefits of the market’s seasonal cadence.
Company Overview
Synchrony Financial (SYF), a leading provider of consumer financial services, empowers individuals and businesses through a diverse range of credit products. The company’s core offerings include credit cards, installment loans, and promotional financing programs, tailored to meet the evolving needs of its target market. Synchrony partners with reputable retailers, healthcare providers, and other businesses to offer branded payment solutions, fostering customer loyalty and driving sales growth.
Synchrony generates revenue primarily through interest income earned on loans, interchange fees from credit card transactions, and fees associated with loan origination and servicing. Its value proposition lies in providing customized financial solutions that enhance customer experiences, enabling partners to acquire and retain customers while driving their overall profitability.
Synchrony operates on an asset-light model, relying on its extensive network of partnerships to originate loans and distribute its products. This approach minimizes its credit risk and allows it to maintain a lean cost structure. The company emphasizes data analytics and technology to optimize its underwriting processes, manage risk, and deliver personalized experiences to its customers.
Synchrony’s growth strategy centers on expanding its partnerships, introducing new products and services, and leveraging technology to enhance its operational efficiency. The company seeks to capitalize on the растущий demand for consumer credit, particularly in the e-commerce and healthcare sectors. Additionally, Synchrony aims to penetrate new markets and verticals, diversifying its revenue streams and customer base.
The consumer financial services industry is highly competitive, with numerous players offering a wide range of products and services. Synchrony differentiates itself through its focus on tailored solutions, data-driven insights, and a commitment to building long-term partnerships. The company’s deep understanding of customer behavior and its ability to provide innovative financial solutions position it well to navigate industry challenges and maintain its leadership position.
Strategy Overview
Embarking on the financial journey with Synchrony Financial (SYF), a company whose roots are entrenched in consumer financial services, our exploration delves into a backtested monthly seasonality trading strategy that has been meticulously crafted for this stock. This approach is not just a mere set of rules; it is a distilled essence of historical patterns, providing a structured path for investors to potentially capitalize on the rhythmic ebb and flow of the stock market.
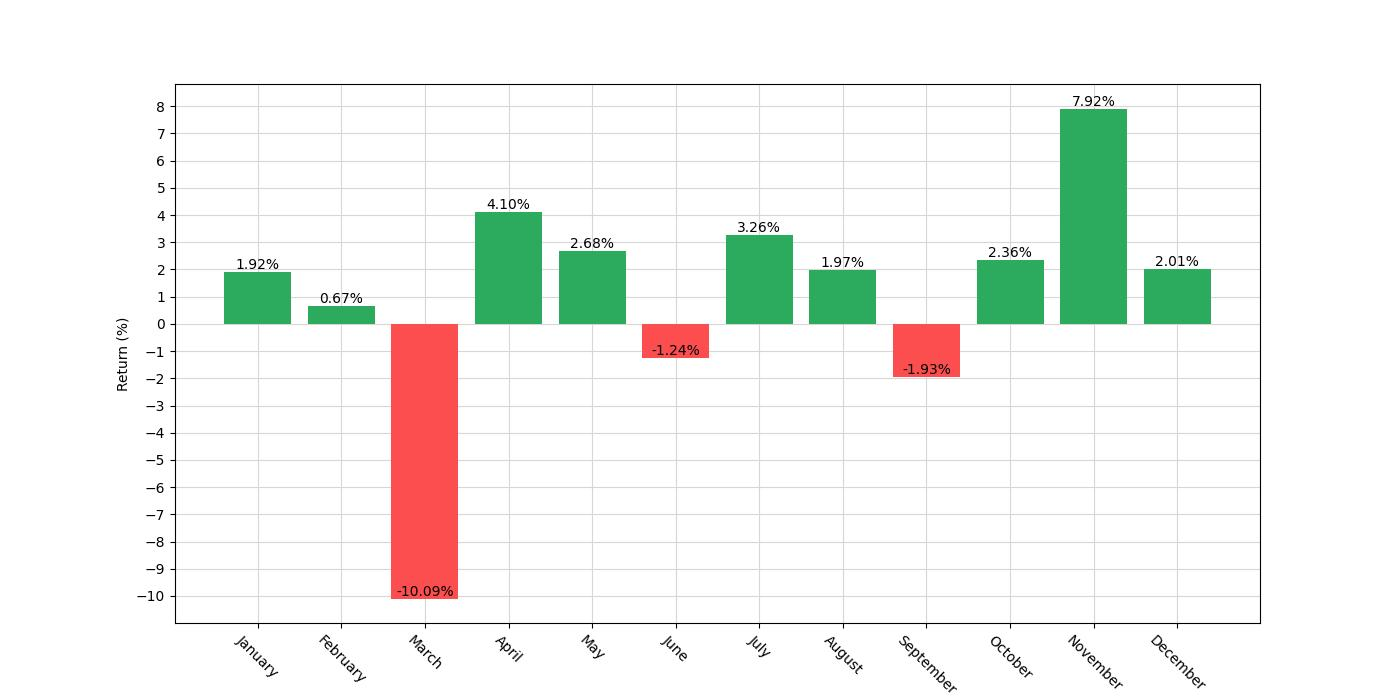
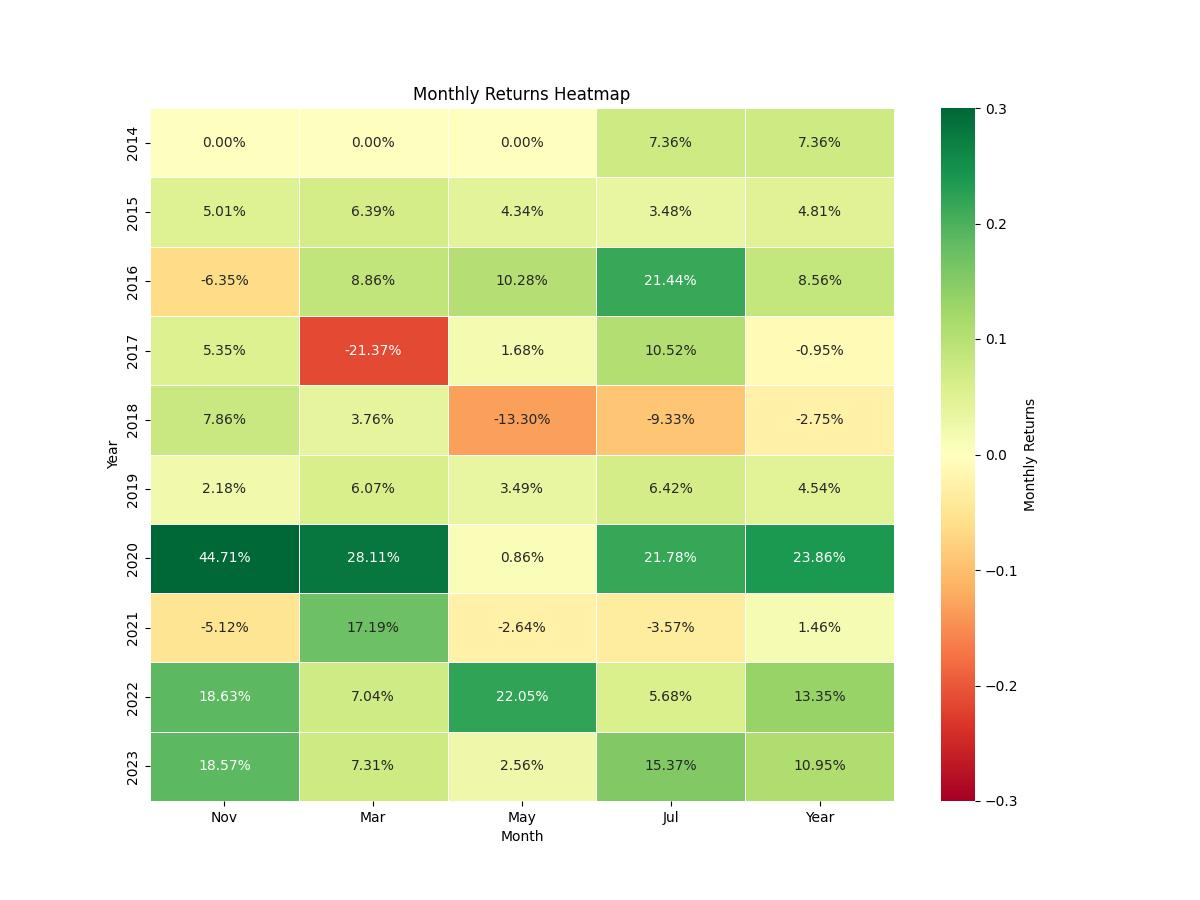
The strategy’s foundation is built on the analysis of SYF’s historical performance, taking positions based on the recurring tendencies observed in specific months. From the starting capital of $10,000, the rules are straightforward yet powerful: initiate a long position during the months of April, May, July, and November, while taking a short position for the month of March. This cadence of trading taps into the heart of seasonality, aligning investment moves with the predictable patterns of the market as it cycles through the year.
The journey of this strategy commenced on July 31, 2014, and extended all the way to December 29, 2023, covering a span of 3438 days. Within this period, the strategy was active 41.96% of the time, indicating a focused approach to market engagement rather than a constant exposure. This targeted stance is designed to capitalize on the most opportune times as suggested by historical data, rather than being perpetually at the mercy of market whims.
It’s important to clarify that this backtesting assumes an ideal trading environment, with no commissions to erode profits, and no slippage that often occurs during actual trading. Such assumptions are common in backtesting to isolate the effectiveness of the strategy itself, though in real-world application, these factors would need to be considered.
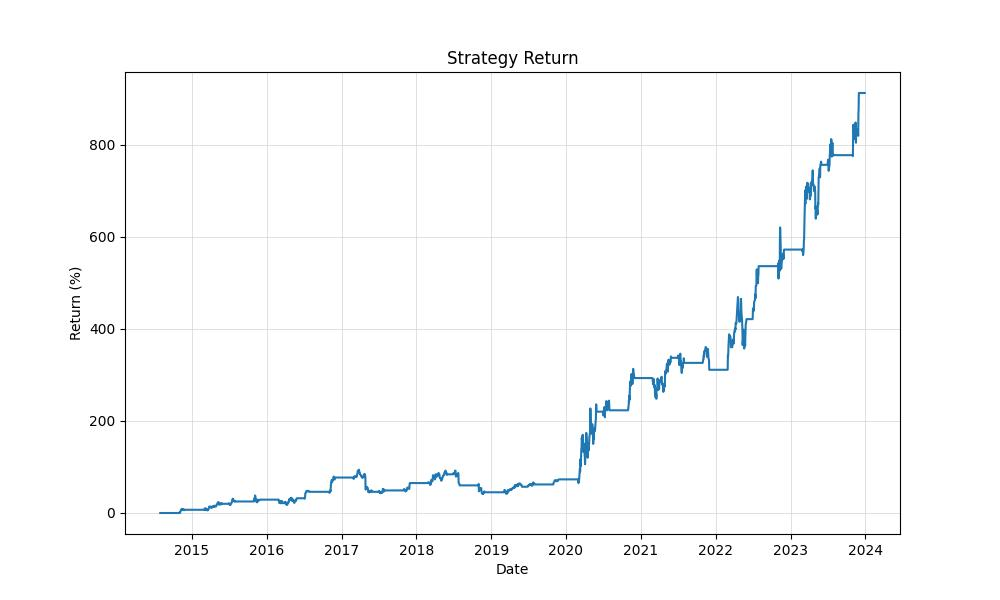
The strategy’s tenure saw the initial capital swell significantly, showcasing the potential power of strategic seasonal trading. The closing equity reached a peak of $101,229.68, an impressive feat when considering the strategy’s selective market involvement. This points to a strategy that does not merely keep pace with the market but leverages timing to potentially amplify gains.
In comparison to a simple buy-and-hold approach over the same period, the strategy demonstrates a compelling advantage. The buy-and-hold strategy, which represents the baseline performance of the stock, delivered a return of 100.32%, a respectable figure in its own right. However, our seasonal strategy eclipses this with a staggering 912.30% return, a testament to the power of timing and market understanding. With an annualized return of 27.89%, the strategy significantly outstrips the annualized buy-and-hold return of 7.71%, illustrating the potential benefits of an active, seasonally-adjusted approach over a passive investment strategy.
Through this lens, we see a vivid portrayal of a trading strategy that does not just dance to the tune of the market’s seasonal rhythms but does so with a calculated and disciplined approach. For the astute investor, this strategy offers a blueprint, one that has been backtested against the unforgiving scrutiny of historical data, revealing a path that has the potential to navigate the temporal aspects of the stock market with finesse.
Key Performance Indicators
When evaluating the efficacy of a trading strategy, the performance metrics are critical for investors to understand the potential benefits and drawbacks of the approach. In the case of Synchrony Financial (SYF), a monthly seasonality trading strategy has been backtested to discern its viability. Let’s delve into the numbers to gauge the success of this strategy.
The strategy’s finale equity, revealing the end value of the initial capital after the trading period, stands at an impressive $101,229.68. To put this into perspective, the initial capital was $10,000, which means the strategy has yielded a substantial return. The equity peak, which is the highest value the investment reached during the backtesting period, aligns with the final equity, indicating that the investment did not experience a significant drop-off from its peak value.
The total percentage return over the course of the backtesting period is 912.30%, a figure that towers over the buy & hold return of 100.32%. This stark contrast underscores the potential advantages of employing a targeted trading strategy over a simple buy and hold approach for this particular stock.
Breaking down the returns on an annual basis provides further clarity. The annualized return of the strategy is 27.89%, a robust figure that suggests the strategy can significantly augment an investor’s portfolio on a year-to-year basis. This is especially notable when compared to the annualized buy & hold return of 7.71%, which while respectable, is substantially lower than the returns generated by the seasonal trading strategy.
These figures are particularly compelling for retail investors considering the seasonal strategy as a means to potentially enhance their investment growth. However, it’s essential to bear in mind that past performance is not always indicative of future results, and investing always carries risk. Nonetheless, the backtested data for SYF presents a strong case for the monthly seasonality strategy within the given time frame.
Risk Management
In the pursuit of a balanced investment strategy, the consideration of risk is paramount. A meticulous backtest of the monthly seasonality trading strategy for Synchrony Financial (SYF) reveals intriguing insights into its risk profile, which investors must weigh against potential returns.
The annualized volatility, a statistical measure of the dispersion of returns, stood at 33.49% for the trading strategy. This figure is notably lower than the 42.26% volatility observed in the buy-and-hold approach over the same period. Lower volatility in the context of this trading strategy suggests that the price movements were less erratic, potentially offering a smoother investment ride compared to the passive strategy.
A key metric in assessing the risk-adjusted performance is the Sharpe Ratio, which for this strategy is 0.83. This ratio compares the strategy’s excess returns over the risk-free rate to its volatility. A Sharpe Ratio greater than 1 is generally considered excellent, between 0.5 to 1 is good, and less than 0.5 is considered sub-optimal. Here, the strategy’s Sharpe Ratio indicates that it has delivered good risk-adjusted returns, outperforming many investments with a comparable level of risk.
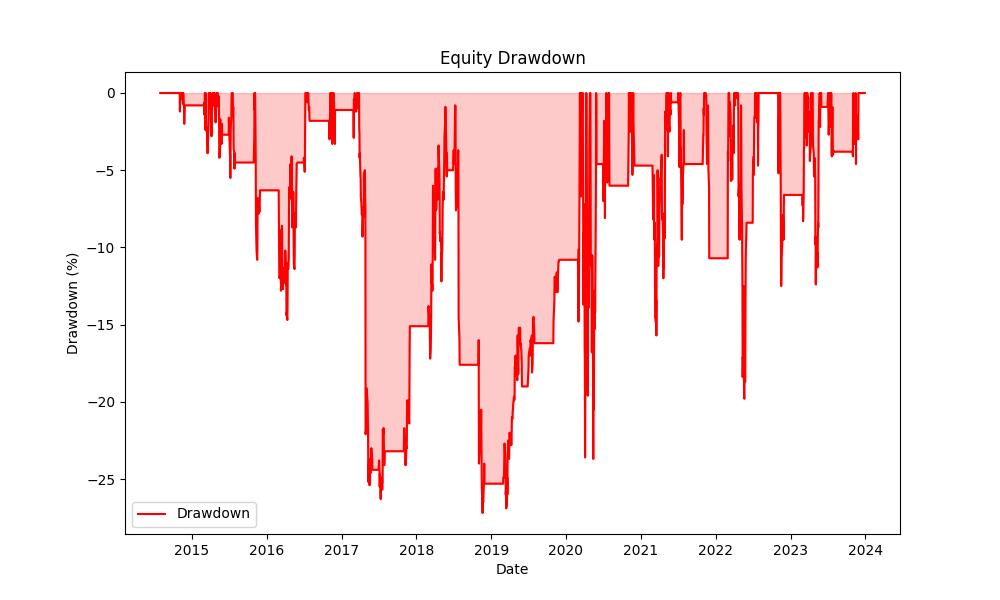
Another aspect to consider is the strategy’s maximum drawdown, which represents the largest peak-to-trough decline in the account’s value. At -27.18%, the strategy’s drawdown is substantial, yet it is significantly less than the -66.31% drawdown experienced by the buy-and-hold approach. This suggests that the strategy may be better at mitigating large losses, which is an essential consideration for the risk-averse investor.
Moreover, the average drawdown, which provides an average of the strategy’s dips, was recorded at -5.15%. This is less severe when compared to the average drawdown of the buy-and-hold strategy at -6.97%, indicating that any typical losses are generally lower with the trading strategy.
The max drawdown duration, or the longest time taken to recover from the peak to the trough, was 1078 days for the strategy. This is a considerable period, yet it is important to note that the buy-and-hold strategy experienced a slightly longer duration of 1083 days. Investors considering this strategy should be prepared for periods of significant value decline before a recovery ensues.
On average, the duration of drawdowns for the strategy was 48 days, which is substantially shorter than the 75 days average duration for the buy-and-hold strategy. This indicates that while the strategy can experience declines, these are often resolved more swiftly, allowing for potential recovery and continued pursuit of equity growth.
In synthesis, the backtest results suggest that the monthly seasonality trading strategy for Synchrony Financial, while not without risk, offers a compelling risk profile. With lower volatility and drawdowns compared to a passive investment approach, and a respectable Sharpe Ratio, this strategy could potentially be a valuable component of a diversified investment portfolio, especially for those seeking to mitigate risk while capitalizing on specific seasonal trends in the stock market.
Trade Analysis
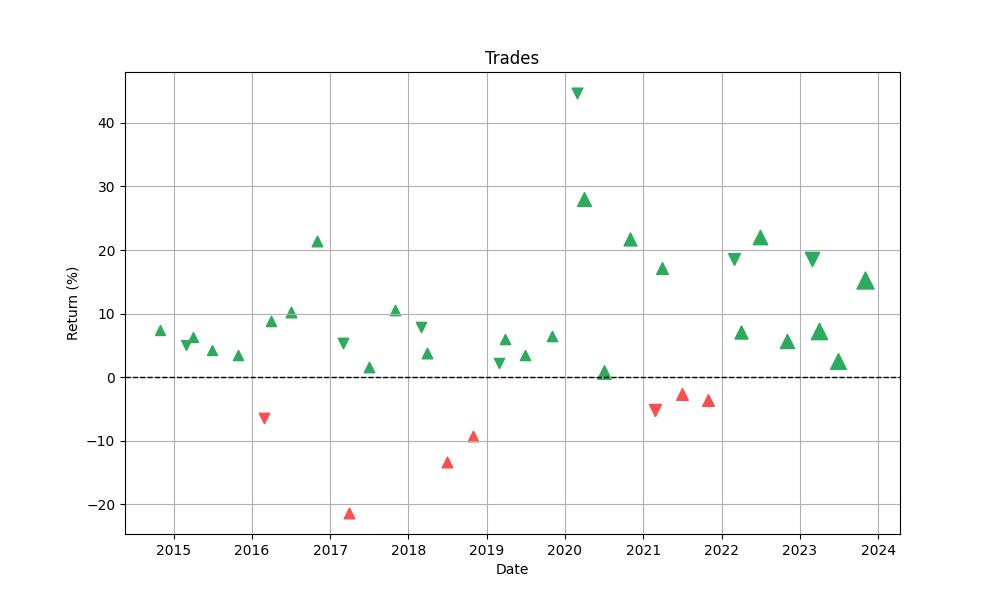
Diving into the intricacies of the trading strategy applied to Synchrony Financial (SYF), we uncover a pattern of disciplined trading that is both meticulous and revealing. Throughout the backtesting period, a total of 37 trades were executed, demonstrating a strategic approach rather than frequent, high-volume trading. This restraint is indicative of a methodical strategy that favors precision over quantity.
A striking aspect of the trade history is the win rate, which stands at an impressive 81.08%. This figure suggests a high level of efficacy in the strategy’s ability to capitalize on the months identified as historically profitable. Such a win rate is commendable and may instill confidence in investors who are considering a similar seasonal approach.
The strategy’s best trade showcases a remarkable gain of 44.71%, a testament to the potency of the strategy during its most favorable conditions. Conversely, the worst trade resulted in a loss of -21.37%, which, while significant, is a solitary low point in an otherwise fruitful series of trades. The average trade yielded a return of 6.46%, underscoring a consistent generation of positive outcomes over time.
In terms of time in the market, the strategy’s trades varied in duration. The longest trade spanned 63 days, while on average, positions were held for 38 days. This moderate holding period reflects the monthly seasonality approach, aligning with the natural ebb and flow of the market’s monthly patterns.
Another critical metric is the Profit Factor, which in this case is 5.26. This ratio of gross profits to gross losses is a robust indicator of the strategy’s overall profitability, revealing that the gains were more than five times the size of the losses. Such a ratio is a strong endorsement of the strategy’s effectiveness.
The Expectancy of 7.10% further solidifies the strategy’s performance, indicating the average amount an investor could expect to win (or lose) per trade. This positive expectancy, combined with the high win rate, suggests a favorable risk-reward scenario for investors engaging in this seasonal strategy.
The System Quality Number (SQN) is a measure that can be used to evaluate the overall quality of a trading system. With a value of 3.61, the strategy falls into the ‘good’ category, meaning it has a solid foundation for generating consistent and reliable returns.
Conclusion
In conclusion, the seasonal trading strategy applied to Synchrony Financial (SYF) presents a compelling case for investors looking to enhance their portfolios with a disciplined, data-driven approach. The strategy’s backtested performance offers a glimpse into the potential of leveraging seasonal patterns, with an impressive return of 912.30% over the test period, far surpassing the baseline buy-and-hold strategy. Coupled with an annualized return that significantly outperforms the market’s average, this approach exemplifies the advantage of timing the market with precision and insight.
The risk profile of the strategy is particularly noteworthy, with lower volatility and drawdowns than those associated with a passive investment approach, indicating a smoother and potentially less stressful investment experience. The respectable Sharpe Ratio and shorter average duration of drawdowns further bolster the case for the strategy’s risk-adjusted efficiency.
Trade analysis reveals a high win rate and a Profit Factor that speaks volumes about the strategy’s ability to capitalize on favorable market conditions. With a high expectancy and a System Quality Number categorizing the strategy as ‘good,’ investors have quantitative evidence of a robust trading system that has historically provided consistent and reliable returns.
While past performance is not indicative of future results and all investment strategies carry inherent risk, the backtested data for the monthly seasonality strategy on SYF suggests that strategic, seasonal investment decisions, grounded in historical market analysis, can be an effective way to navigate the stock market’s temporal fluctuations. Investors eyeing this strategy should consider the potential for above-average returns and a managed risk profile as they seek to optimize their investment approach in alignment with the seasonality of the markets.

“Make the invisible visible. My goal is to shine a light on the subtle seasonal signals in the stock market, providing investors with the insight needed to make informed decisions. By breaking down the complexities of seasonality, I strive to empower our audience with knowledge and foresight, turning data into action.”