Introduction
In the intricate dance of the stock market, the ebbs and flows of stock prices are often punctuated by rhythmic patterns that can be as predictable as the seasons themselves. As investors, understanding these cyclical trends can be the key to unlocking potential gains that might otherwise remain hidden within the chaotic symphony of market movements. Seasonality in trading is not just a theory; it’s a phenomenon backed by historical data and the repeated behaviors of market participants responding to various economic, political, and psychological stimuli throughout the year.
In this comprehensive guide, we’ll delve into the world of seasonal stock market strategies, using Dominion Energy, Inc. as our case study. Investors and traders alike are perpetually seeking an edge—a way to slice through the noise and leverage time-tested patterns to bolster their portfolios. The allure of a seasonal trading strategy lies in its simplicity and the promise of capitalizing on predictable periods of strength within a company’s market performance.
Our exploration will take us on a journey through the practical application of a monthly seasonality trading strategy, rigorously backtested over a span of nearly two decades. We will dissect the strategy’s performance, pinpoint the optimal months for market participation, and compare it against the traditional buy and hold approach. By marrying historical market performance with disciplined strategy execution, we aim to offer you a navigational chart through the seasonal seas of the stock market.
Whether you’re a seasoned investor or just dipping your toes in the financial waters, this guide seeks to demystify the seasonal patterns of Dominion Energy’s stock performance, providing you with actionable insights and a clearer understanding of how to potentially enhance your investment returns. So, buckle up and prepare to embark on an analytical odyssey that will arm you with the knowledge to make informed decisions based on the seasonality of the stock markets.
Company Overview
Dominion Energy, Inc. is a diversified energy company headquartered in Richmond, Virginia. The company’s core business segments include Electric Generation, Electric & Gas Distribution, Gas Infrastructure, and Energy Services. Dominion Energy is a major player in the electric and gas utility industry in the United States, serving customers in Virginia, North Carolina, South Carolina, Ohio, West Virginia, and Maryland. The company’s revenue streams are derived from the sale of electricity, natural gas, and energy services, as well as transmission and distribution services. Dominion Energy’s value proposition lies in its focus on providing reliable and affordable energy to its customers, as well as its commitment to environmental stewardship. The company’s operational model is characterized by a vertically integrated business structure, which allows for greater control over the entire energy value chain. Dominion Energy’s growth strategy involves investments in renewable energy sources, energy efficiency programs, and infrastructure upgrades. The company operates in a highly competitive industry characterized by technological advancements, regulatory changes, and environmental concerns. Despite these challenges, Dominion Energy remains a financially sound company with a strong track record of dividend payments, making it a compelling investment opportunity for income-oriented investors.
Strategy Overview
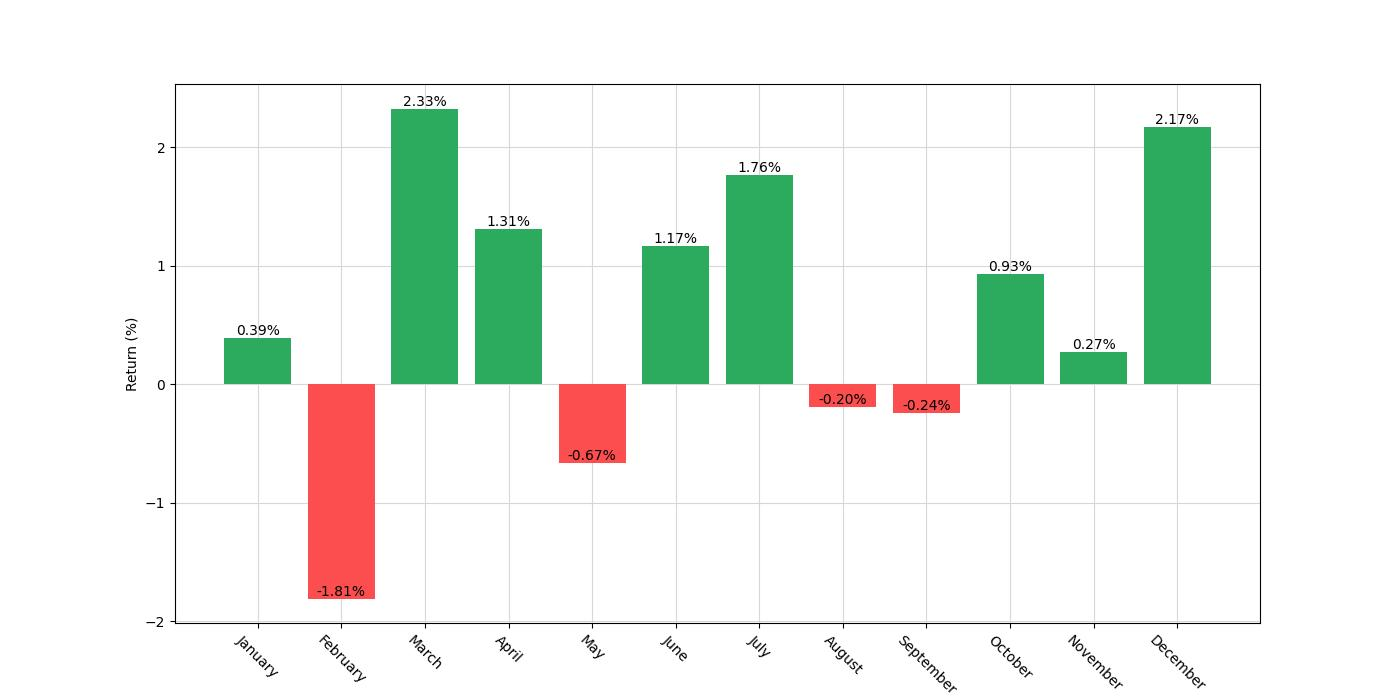
In exploring the efficacy of seasonal trading strategies, we turn our attention to Dominion Energy, Inc., a company that has been subjected to a backtest of a monthly seasonality trading strategy. The strategy itself is straightforward in its approach, opting for long positions in the stock specifically during the months of March, April, July, and December. These periods have been identified through historical data as potentially advantageous times to maintain a long position in Dominion Energy based on its past performance trends.
The backtest, which spans nearly two decades, from January 2, 2004, to December 29, 2023, encapsulates a duration of 7301 days, offering a substantial temporal landscape to evaluate the strategy’s robustness. During this period, the strategy dictated market exposure for approximately 34.83% of the time. This limited market exposure is a deliberate design to capitalize on the historical seasonal strengths of the stock while mitigating exposure during other less predictable or historically weaker months.
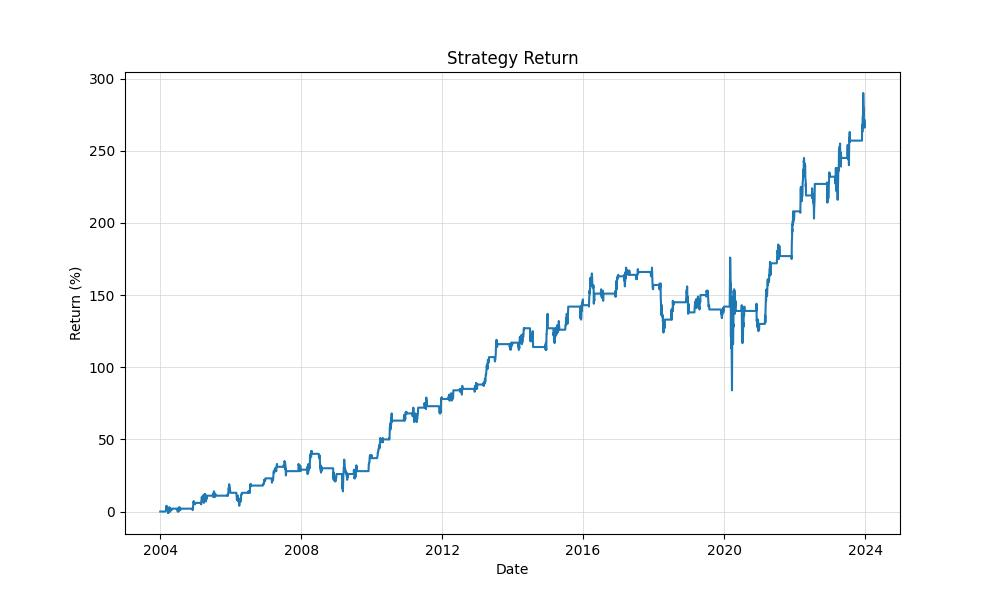
The initial capital allocated for this strategy was $10,000, and over the course of the backtest, this amount saw an impressive growth to an equity final balance of $37,057.36. It’s worth noting that at one point, the equity peaked even higher at $38,954.03. When we translate these figures into a percentage return, the strategy yielded a 270.57% return over the nearly 20-year period. To put this in perspective, the buy and hold return for the same period was 229.76%—notably lower, yet still an impressive figure.
The annualized return (Return [Ann.]) for the strategy stands at 6.78%, which, when compared to the annualized buy and hold return of 6.21%, further underscores the effectiveness of the seasonal trading approach. It’s important to highlight that these returns were achieved without factoring in commissions or slippage, which could moderately adjust the performance metrics in a real-world scenario.
Investors should take note that this strategy does not employ short positions at any point during the year, which is a conservative approach that some might find appealing. Such a strategy could be attractive for those who are risk-averse or who believe in the long-term value proposition of the underlying asset, yet still seek to optimize their investment timing based on historical patterns.
Overall, the backtest results suggest that the disciplined application of a seasonal trading strategy with Dominion Energy could potentially enhance returns when compared to a simple buy and hold strategy. The selective nature of the long positions, based on specific months identified through historical performance, provides a clear and structured approach to investing in this utility sector heavyweight.
Key Performance Indicators
As we delve into the heart of our trading strategy’s performance, it’s crucial to understand how the strategy has fared over time compared to a simple buy-and-hold approach. This understanding comes from examining the returns generated, the growth of the equity, and the consistency of performance over the years.
Our strategy began with an initial capital of $10,000 and, impressively, culminated in a final equity value of $37,057.36. To put this into perspective, this represents a substantial total return of 270.57% over the nearly two-decade span from January 2004 to December 2023. The equity peak, which marks the highest value reached by the account, was even more remarkable at $38,954.03. This peak is a testament to the strategy’s ability to capture significant gains during its most favorable periods.
When we assess performance in terms of annual returns, the strategy exhibits a solid 6.78% average annual return. This figure is particularly noteworthy when we compare it to the buy-and-hold strategy’s annual return, which stands at 6.21%. Although the difference may appear modest, it’s important to remember that these are average figures over a 19-year period, meaning the compounding effect can translate into a significant difference in absolute terms.
The buy-and-hold approach, while slightly less impressive in terms of annualized return, delivered a total return of 233.28% from the same $10,000 initial investment, ending with a final equity of $33,328.34. This indicates that while buy-and-hold is a solid strategy, our seasonal trading approach has outperformed it in terms of total and annualized returns.
However, it’s not just about the returns. The consistency and reliability of returns are what truly define a strategy’s success. This is where the buy-and-hold strategy’s equity peak of $57,720.36 is worth noting. Although higher than our strategy’s peak, it’s crucial to understand that this figure doesn’t account for the timing of returns or the volatility experienced along the way.
Risk Management
Investing in the stock market can be akin to navigating a ship through the ever-changing waters of the ocean; without a compass in the form of risk management, the journey can quickly become perilous. Let’s steer through the ebbs and flows of risk as it pertains to the monthly seasonality trading strategy of Dominion Energy, Inc.
When assessing risk, we often turn our gaze towards volatility, a statistical measure of the dispersion of returns. Annualized volatility for this strategy stands at 14.16%, which is a gauge of how much the investment’s value has fluctuated over a year. In contrast to a sea in turmoil, this number suggests moderate waves—significant enough to warrant attention, but not so high as to be daunting for an experienced sailor.
The Sharpe Ratio, a popular tool used to understand the return of an investment compared to its risk, is 0.478 for our strategy. While a Sharpe Ratio greater than 1 is generally considered excellent, a ratio under 1, as in our case, indicates that the returns are not as high as one might expect given the risks taken. It’s like assessing whether the potential catch is worth the trip out to sea; there’s promise, but also room for improvement.
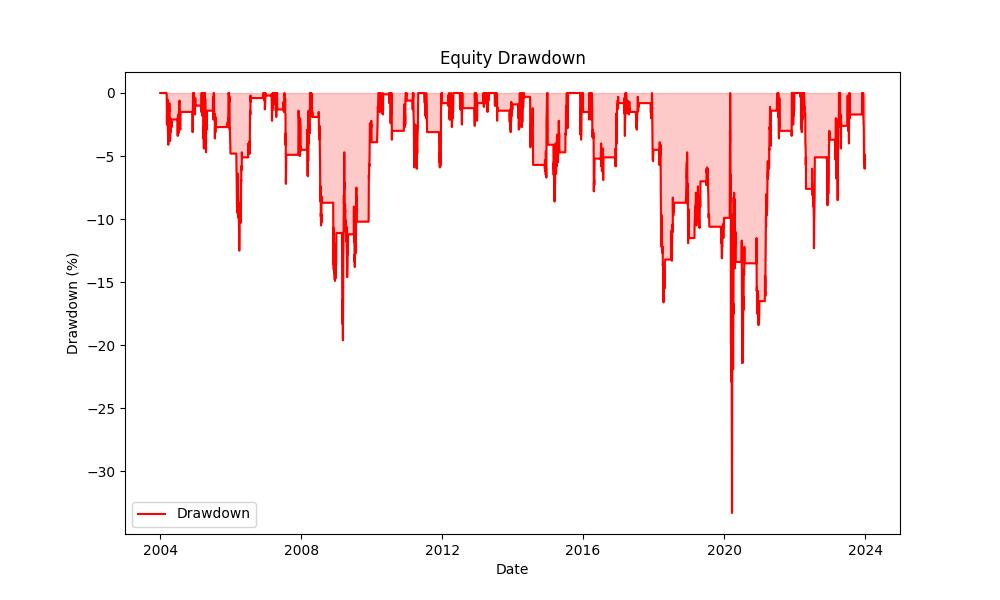
Navigating the treacherous waters of market downturns, our strategy weathered a maximum drawdown of 33.26%. This is the largest drop from peak to trough before a new peak is achieved, and it’s crucial as it gives us a sense of the strategy’s resilience during tough market conditions. Think of this as the heaviest storm one might face; it’s a significant squall, but the ship stays afloat.
The average drawdown, sitting at a more modest 2.8%, tells us that when losses occur, they’re typically not overwhelming. This is akin to the normal swaying of a ship—uncomfortable, perhaps, but generally not cause for alarm.
In terms of duration, the longest period the strategy had to endure under the waves of a drawdown was 810 days, while on average, these periods lasted for 73 days. For sailors of the stock market, this information is crucial; it’s the equivalent of knowing how long you might be weathering a storm and how frequently these storms occur.
Understanding the risk associated with any trading strategy is as important as the lighthouse to a ship nearing the shore. By dissecting volatility, Sharpe Ratio, and drawdown metrics, investors are better equipped to decide if the monthly seasonality strategy for Dominion Energy, Inc. aligns with their personal risk tolerance and investment horizon. Just as the captain must know his ship and the sea, so too must investors understand the full breadth of risk when charting a course through the stock market.
Trade Analysis
Delving into the numbers behind a trading strategy can reveal a treasure trove of insights, and that’s certainly true when examining the monthly seasonality strategy applied to Dominion Energy, Inc. (Symbol: D). This strategy has been backtested over a significant period, from January 2, 2004, to December 29, 2023.
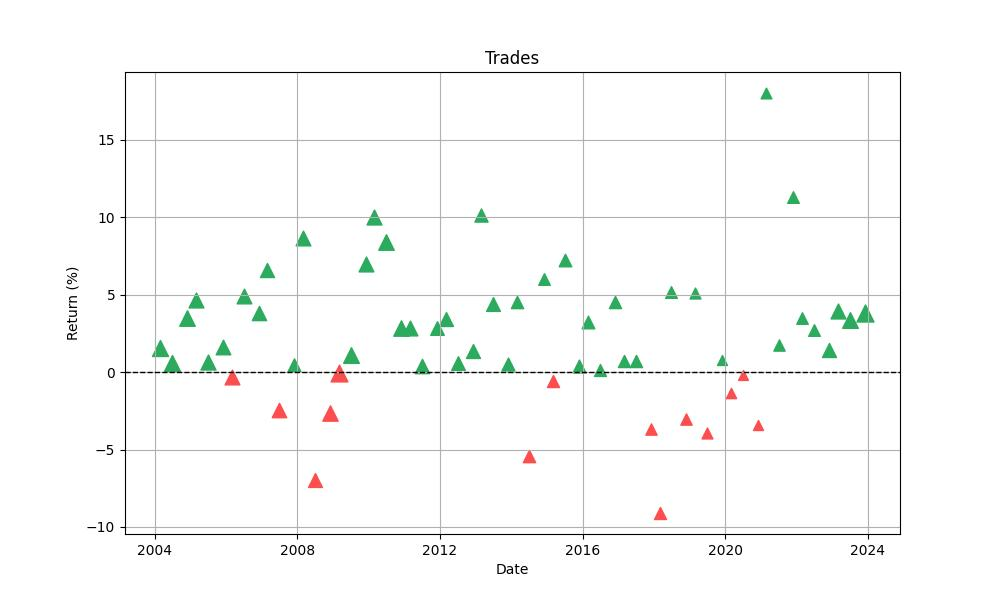
The first notable metric is the number of trades, which stands at 60. Considering the duration of the backtest, this number suggests a selective approach, focusing on opportunities tied to the specified seasonal months. It’s not about making numerous trades; it’s about making the right trades at the right time.
A standout figure from the backtest is the win rate: an impressive 76.67%. This high percentage indicates that the strategy is adept at identifying periods when Dominion Energy’s stock is poised to perform well. With more than three-quarters of trades concluding profitably, investors can gain a certain level of confidence in the method’s predictive power.
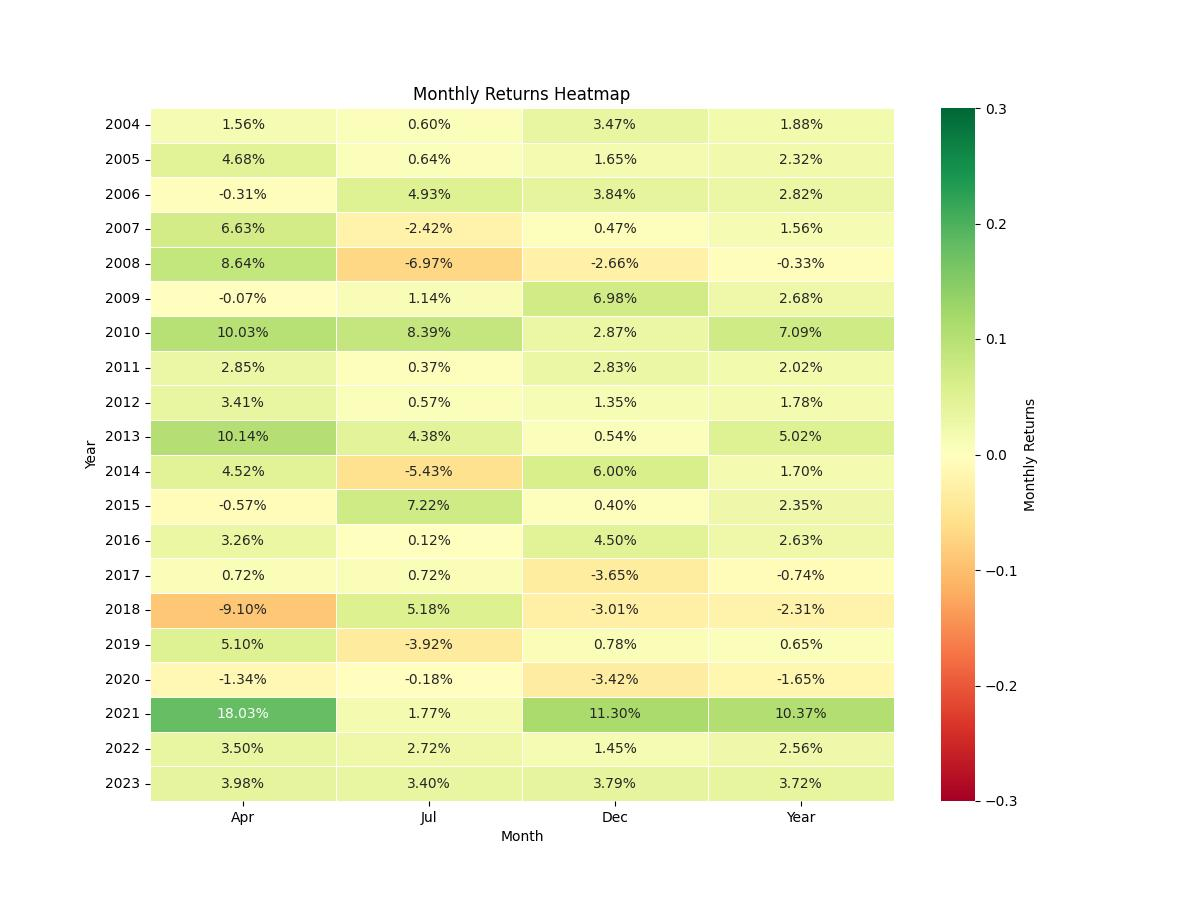
The best trade yielded an 18.03% return, highlighting the potential for significant gains when the strategy aligns perfectly with market conditions. On the flip side, the worst trade recorded a loss of 9.10%, which, while not negligible, is a manageable figure considering the overall strategy performance.
The average trade result stands at a 2.21% return. This average is a solid indicator of what investors might expect from a typical trade within the strategy, excluding the outliers. It’s a figure that, while not as thrilling as the best trade, still represents consistent, incremental growth – the kind that can compound into substantial gains over time.
Trade duration also tells an important story. The longest trade spanned 63 days, while the average trade was open for 41 days. These durations reflect the monthly nature of the strategy, with trades typically not extending beyond a two-month timeframe. This approach allows investors to capitalize on short-term seasonal trends while not being overly exposed to longer-term market volatility.
A vital statistic for assessing the performance of any trading strategy is the profit factor, which, in this case, is an impressive 4.21. This number is calculated by dividing the total gains from winning trades by the total losses from losing trades. A profit factor greater than 1 indicates a profitable strategy, and at over 4, the monthly seasonality strategy for Dominion Energy suggests a significant edge.
Expectancy, which measures the average expected return per trade, sits at 2.31%. This figure helps investors understand what they might expect to earn on average from each trade after considering both wins and losses. Positive expectancy is critical for a successful strategy, and this backtest presents an encouraging figure.
The System Quality Number (SQN), often used to evaluate the quality of a trading system, is an impressive 3.57. This high SQN indicates a system that is both profitable and consistent, providing further confidence in the robustness of the strategy.
When looking at these backtest results, retail investors can glean that the monthly seasonality trading strategy for Dominion Energy has historically provided a high win rate, managed risk well, and delivered consistent, positive returns. This performance suggests that the strategy could be a viable component of an investment approach, particularly for those interested in exploiting seasonal trends in the stock market.
Conclusion
In conclusion, the comprehensive backtest analysis of Dominion Energy, Inc. reveals that a carefully tailored seasonal trading strategy can potentially outperform the traditional buy-and-hold approach. By capitalizing on historically favorable months, the strategy has demonstrated superior total and annualized returns over a nearly two-decade span, while also offering a compelling win rate that underscores its reliability.
The selective nature of this strategy, supported by strong key performance indicators, highlights the benefits of targeted market exposure. Moreover, risk management analysis assures that, although risk is inherent, it is manageable and within reasonable bounds for the prudent investor.
Trade analysis further cements the strategy’s credibility, showcasing a high win rate, a substantial profit factor, and a respectable expectancy value. These metrics collectively paint a picture of a methodical and disciplined approach to seasonal trading that can yield consistent returns while managing risk effectively.
Investors armed with this knowledge can approach the market with greater confidence, understanding the utility of integrating a seasonality-based strategy into their investment portfolio. While past performance is not indicative of future results, the historical data provides a compelling narrative that seasonal trends can be harnessed for investment success. As always, it is crucial for investors to consider their own risk tolerance and investment goals when evaluating any trading strategy.

“Make the invisible visible. My goal is to shine a light on the subtle seasonal signals in the stock market, providing investors with the insight needed to make informed decisions. By breaking down the complexities of seasonality, I strive to empower our audience with knowledge and foresight, turning data into action.”

