


Introduction
As the seasons change, so too do the intricate patterns of the stock market. Astute investors understand that these temporal shifts can offer unique opportunities for portfolio growth—if one knows where to look. Enter the concept of market seasonality, a phenomenon where certain times of the year can statistically favor investment returns. It’s a realm where historical trends whisper secrets of potential future profits, and for those who listen, a strategic edge awaits.
In this exploration, we’ll dive into the seasonality of stock markets and unravel the trading strategies that savvy investors employ to harness these rhythmic patterns. We’re not just talking about the old adage “Sell in May and go away,” but a more nuanced approach that looks at specific months and their historical performance data to inform investment decisions. This is about understanding that the stock market, much like nature, has its seasons—and in those seasons, there are cycles that can be anticipated and potentially profited from.
Our focus will be on a monthly seasonality trading strategy, a method that has been applied with remarkable success to T-Mobile US, Inc. (TMUS), a company whose strong brand and market presence make it a prime candidate for this type of analysis. We will dissect the strategy’s framework, its historical performance, and its potential as a tool in the investor’s arsenal.
This is not just a glimpse into a single company or a one-off trading tactic; it’s a broader look at how embracing the seasonality of the stock market can be a game-changer for investment strategies. So, whether you’re a seasoned trader or a novice investor, prepare to embark on a journey that will illuminate the path of seasonal trading strategies and how they can be leveraged for financial growth.
Company Overview
T-Mobile US, Inc. (TMUS): A Leader in the U.S. Wireless Market
T-Mobile US, Inc. (TMUS) is a leading provider of wireless communications services in the United States, offering a diverse range of products and services to its customers. The company’s core products and services include wireless voice and data plans, mobile device financing, and a variety of value-added services such as mobile banking and entertainment. TMUS primarily targets individual consumers and small businesses, catering to their mobile connectivity and communication needs.
The company generates revenue through subscription fees, device sales, and other service charges. Its value proposition lies in its competitive pricing, extensive network coverage, and innovative service offerings, which have contributed to its growing customer base. TMUS operates a nationwide network of cell towers, fiber optic cables, and spectrum licenses to deliver reliable and high-speed wireless connectivity to its customers.
TMUS follows a customer-centric operational model, focusing on providing a seamless and positive experience to its users. The company invests heavily in network infrastructure and technological advancements to enhance its service quality and expand its network reach. To drive growth, TMUS employs a multi-pronged strategy that includes expanding its 5G network, introducing new products and services, and pursuing strategic partnerships and acquisitions.
The wireless industry in the United States is highly competitive, with major players such as Verizon, AT&T, and Dish Wireless vying for market share. TMUS has consistently gained market share in recent years, positioning itself as a strong competitor in the industry. The company’s aggressive pricing and focus on customer satisfaction have been key factors in its success.
Overall, T-Mobile US, Inc. has established a strong position in the U.S. wireless market through its competitive pricing, extensive network coverage, and innovative service offerings. Its customer-centric approach and growth strategy position the company well to continue expanding its market share and maintaining its leadership position in the industry.
Strategy Overview
Investors often seek to enhance their portfolio returns by capitalizing on market inefficiencies and patterns. One such approach that has garnered attention is the monthly seasonality trading strategy, especially when applied to companies with strong brand recognition and market presence like T-Mobile US, Inc. (TMUS). Delving into the intricacies of this strategy, it’s crucial to examine its framework and historical performance.
The monthly seasonality strategy under review was backtested over a substantial period, beginning on April 19, 2007, and culminating on December 29, 2023. This duration spans 6098 days, which provides a comprehensive set of data to gauge the strategy’s efficacy. Such a long-term analysis is critical in understanding the consistency and reliability of seasonal trends in stock performance.
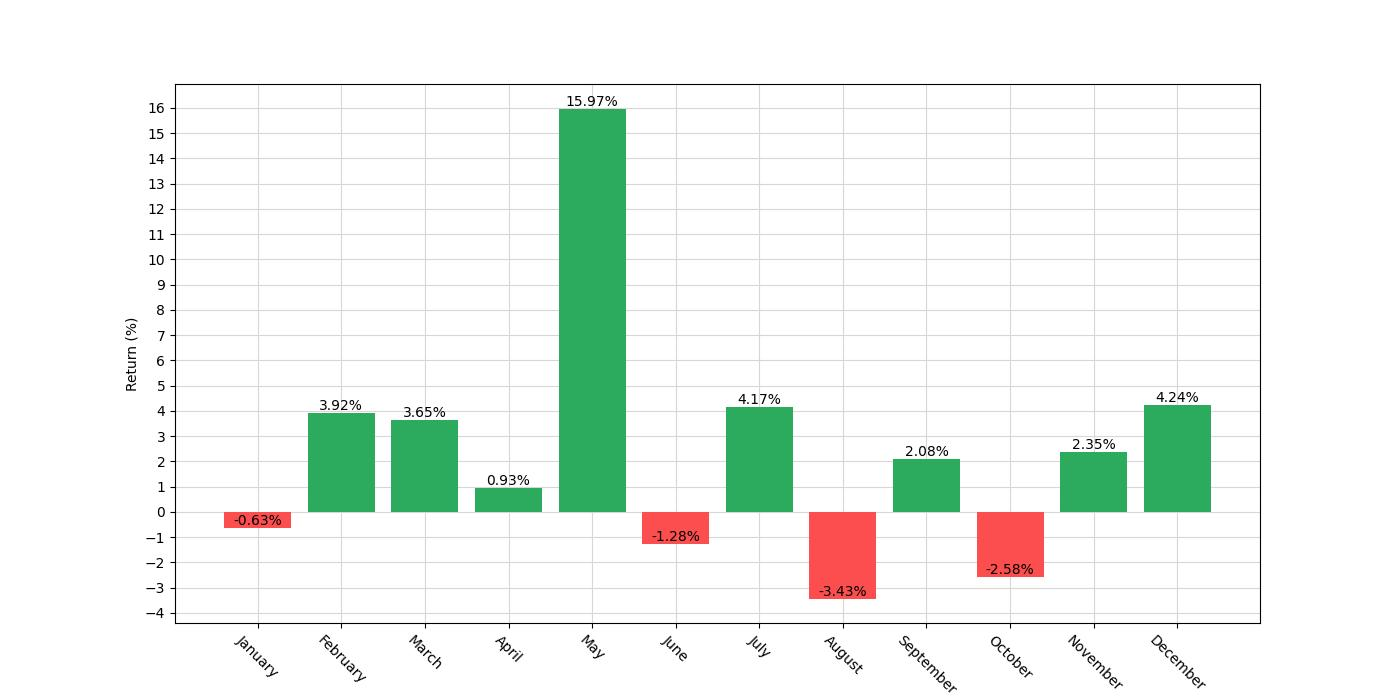
The strategy operates on a simple premise: it holds a long position in T-Mobile shares exclusively during the months of April, May, and December. The rationale behind selecting these specific months is rooted in historical patterns that suggest a recurrent positive performance during these periods. It is important to note that the strategy does not engage in short positions during any month, which means it remains uninvested outside the mentioned months. This approach can be considered conservative as it avoids potential losses from betting against the stock.
In terms of market exposure, the strategy is active 25.71% of the time. This relatively low exposure indicates that the capital is at risk only for about a quarter of the year, allowing for a risk-averse stance while still attempting to capture the upside during the identified seasonal windows.
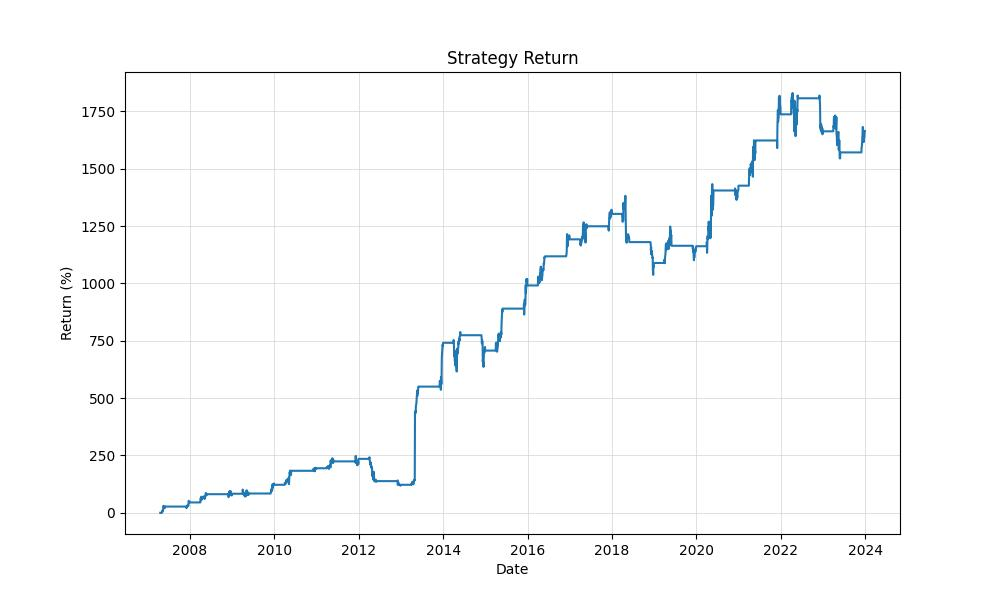
The initial capital allocated for this backtesting exercise was set at $10,000. This figure is a common starting point for retail investors, making the results relatable and easier to extrapolate for different investment levels. Over the backtesting period, this strategy yielded an impressive final equity value of $176,498.51, with the equity peaking at $192,953.80. To put this into perspective, this translates to a return of 1664.99%, significantly outperforming the buy-and-hold return of 775.82% for the same period. Moreover, the annualized return stands at 18.77%, offering a compelling case for the effectiveness of the strategy over the long term.
This backtested strategy showcases not only the potential for high returns but also the benefits of a tactical, seasonal approach to the stock market. By leveraging historical patterns and limiting market exposure to specific high-probability months, the strategy aims to maximize gains while mitigating the risks associated with continuous market fluctuations.
For retail investors, such a strategy presents an intriguing alternative to traditional buy-and-hold approaches. It emphasizes the importance of timing and market cycles, offering a structured method to possibly enhance returns by taking advantage of the seasonality observed in T-Mobile’s stock performance. However, it’s essential for investors to understand that past performance is not indicative of future results, and such strategies should be considered within the broader context of one’s investment objectives and risk tolerance.
Key Performance Indicators
When we delve into the heart of any trading strategy, it’s essential to examine the performance metrics that paint a clear picture of its effectiveness. Let’s explore these through the lens of our monthly seasonality trading strategy applied to T-Mobile US, Inc. (TMUS).
Our journey began with an initial investment of $10,000, and as we navigated through selected months—April, May, and December, earmarked for going long—our strategy’s fruitfulness became evident. Over the course of the backtesting period, which stretched from April 19, 2007, to December 29, 2023, the equity in our trading account burgeoned to an impressive $176,498.51. To put this into perspective, the peak of our financial mountain reached even higher elevations, with the strategy’s equity zenith at $192,953.79.
The overall return is a figure that demands attention: a staggering 1664.98%. In comparison, a standard buy-and-hold approach with T-Mobile over the same period would have yielded a 775.82% return. The distinction here is more than numerical; it’s a testament to the potential power inherent in a well-crafted seasonal strategy.
Breaking down the returns to an annualized figure allows us to level the playing field and assess performance irrespective of the strategy’s duration. Here, our strategy shines again with an annualized return of 18.77%, outstripping the buy-and-hold annualized return of 13.54%. This outperformance is not just a matter of higher gains; it reflects a more strategic allocation of capital, with our exposure time to the market being only 25.71% of the total duration. This means that for roughly three-quarters of the time, the capital was not exposed to the market’s fluctuations and risks inherent with a continuous investment.
Understanding the performance of a trading strategy isn’t complete without considering the return relative to the risks taken to achieve it. The volatility, a measure of the variation in returns, for our strategy on an annualized basis stood at 38.84%. This figure, while substantial, is measured against the more tumultuous volatility of the buy-and-hold strategy, which clocked in at a higher 59.27%. This suggests that our trading strategy experienced fewer extreme swings in its equity curve, which is a desirable characteristic for many investors who prefer a smoother investment journey.
The Sharpe ratio, which adjusts the returns of an investment by the risk-free rate of return and then divides by the standard deviation, was 0.48 for our strategy. While a Sharpe ratio of 1 or above is often sought after, it’s important to note that this ratio is still indicative of a positive excess return over the risk-free rate, given the strategy’s significant overall return.
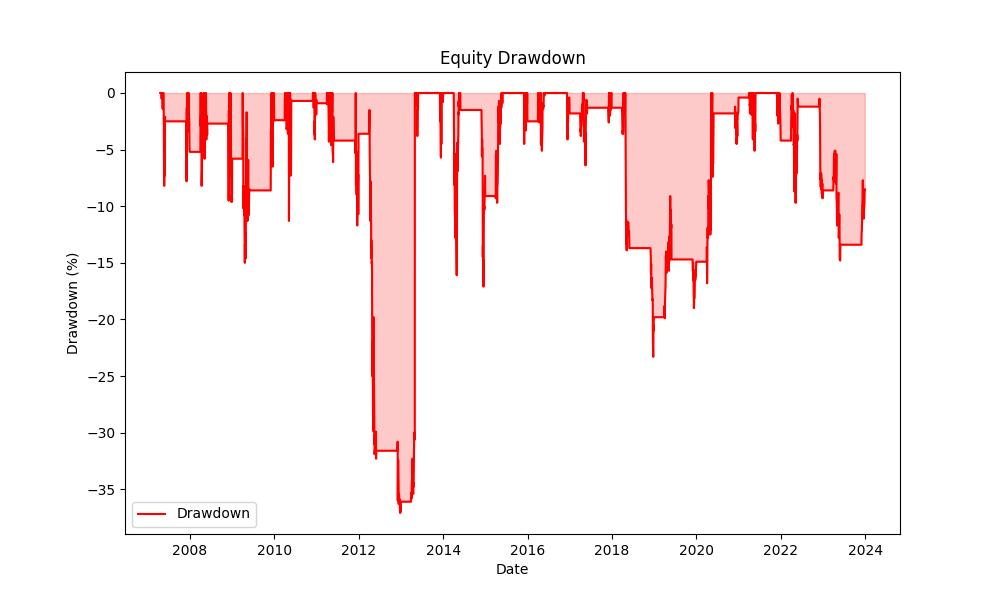
An often overlooked but crucial aspect of performance is the depth and duration of drawdowns. The maximum drawdown, which represents the largest drop from peak to trough in our account equity, was -37.09%, occurring over a span of 752 days. By comparison, the buy-and-hold strategy experienced a far more severe maximum drawdown of -86.26%. Additionally, the average drawdown for our strategy was -4.65% with an average duration of 70 days, signaling shorter and less severe declines compared to holding the stock continuously.
Risk Management
When we delve into the realm of investments, the paramount aspect that every astute investor scrutinizes is risk management. In the case of T-Mobile US, Inc., the monthly seasonality trading strategy we’ve backtested offers a fascinating glimpse into how managing risk can substantially impact investment outcomes.
Analyzing the annualized volatility, which is a statistical measure of the dispersion of returns for a given security, we observe a figure of 38.84% for our strategy. This percentage is a touchstone for understanding the potential variation in investment returns, and in comparison to the buy and hold approach, which registers a higher volatility of 59.27%, our strategy exhibits reduced fluctuations. This is an encouraging sign for investors seeking to temper potential swings in their portfolio’s value.
The Sharpe Ratio, a metric that gauges the performance of an investment compared to a risk-free asset, after adjusting for its risk, stands at 0.483 for the strategy. This number, though not exceedingly high, suggests that the excess return of the strategy over the risk-free rate is reasonable when considering the volatility endured. It’s a reminder that the returns are not just a product of market movements, but also of the strategic entry and exit points based on the seasonality effect.
Next, let’s consider the Maximum Drawdown, an indicator of the largest single drop from peak to trough before a new peak is achieved, which sits at -37.09%. While this number might give investors pause, it’s essential to juxtapose it with the -86.26% maximum drawdown of the buy and hold method. This stark contrast showcases the strategy’s ability to shield capital from the more severe downturns that a long-term hold position might encounter.
Diving deeper, the Average Drawdown is at a manageable -4.65%, and the strategy’s average drawdown duration is 70 days. These figures are critical as they represent the typical decline an investor might expect and the average time it may take to recover to previous equity levels. By comparison to the buy and hold strategy’s average drawdown of -5.79%, our strategy seems to offer a smoother ride through the market’s inevitable ups and downs.
Lastly, the Max Drawdown Duration, which is the longest time an investment has taken to recover to the previous peak, is noted at 752 days for our strategy. While this timeframe may not be insignificant, it is important to remember that the buy and hold strategy has seen a duration of 2284 days. This stark difference illustrates the advantage of a strategy that can adapt to market conditions, potentially allowing for quicker recovery from losses.
Trade Analysis
When delving into the trade analysis of T-Mobile US, Inc.’s monthly seasonality trading strategy, it’s essential to dissect the performance metrics and decipher what they tell us about the strategy’s effectiveness.
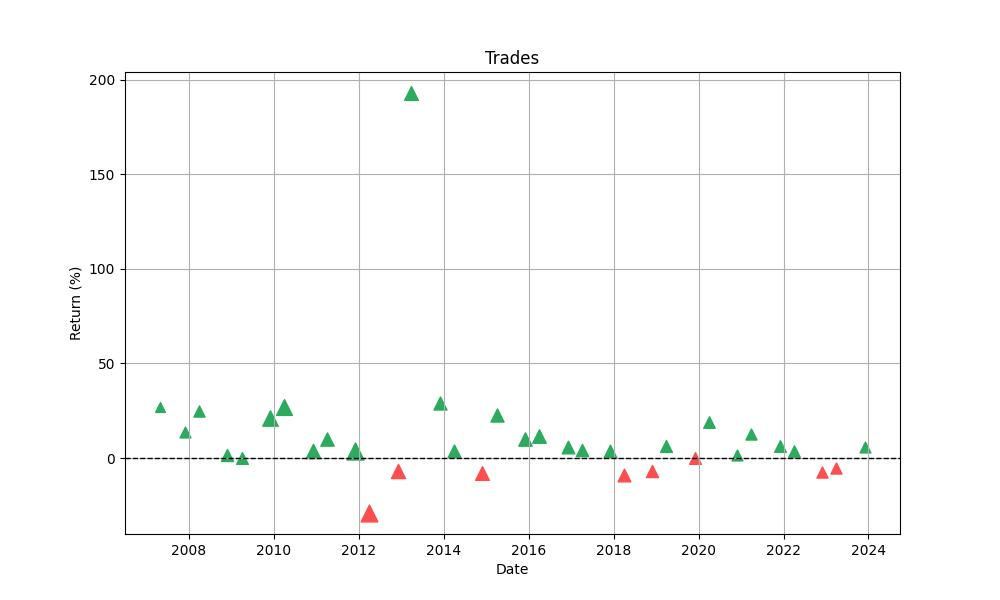
In our backtesting scenario, we observed a total of 34 trades over the test period. This number in itself may seem modest; however, it’s the quality and outcome of these trades that truly matter. A standout statistic is the win rate, sitting at an impressive 76.47%. This high percentage indicates that the strategy is adept at picking the right months to go long on T-Mobile US, Inc., with three-quarters of the trades ending in profit.
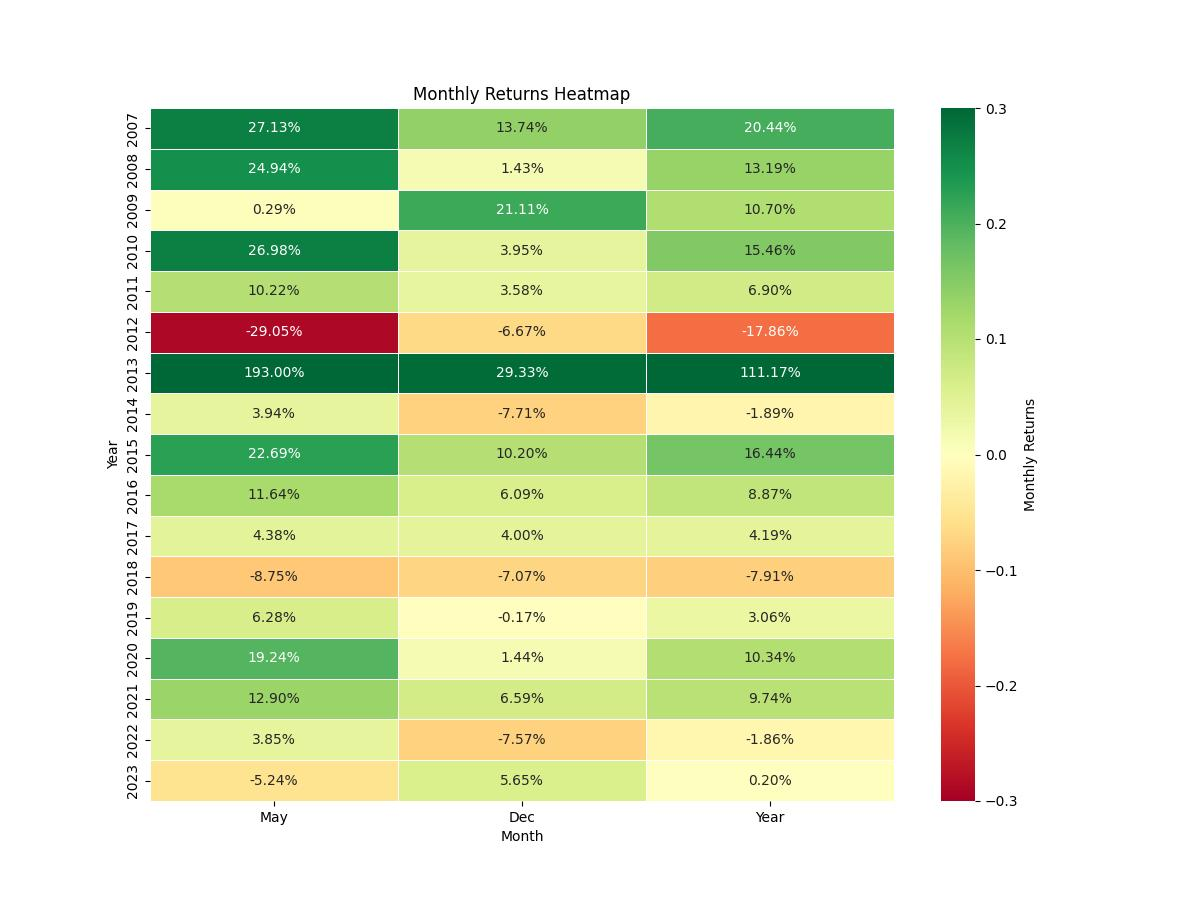
Diving deeper into individual trade performance, the best trade yielded an eye-opening 193.00% return. Such a figure highlights the potential of seizing the right moments in the market, which can lead to significant gains. On the flip side, the strategy was not immune to losses, with the worst trade marking a -29.05% return. Although losses are an inevitable part of trading, this strategy seems to have contained them well.
The average trade return gives us a more nuanced understanding, clocking in at 8.81%. This number is indicative of consistent performance rather than a strategy reliant on outlier trades. Furthermore, the average trade duration was 45 days, which suggests that the strategy doesn’t require investors to lock in capital for extended periods. The longest trade remained open for 64 days, which is relatively short-term in the grand scheme of investing.
Now, let’s talk about profitability. The profit factor, an essential gauge of a strategy’s effectiveness, stands at a robust 6.57, underscoring that the gross profits dwarf the gross losses by a considerable margin. In other words, for every dollar lost, the strategy has historically made over six dollars in profit.
Another critical metric is the expectancy, which comes in at 11.83%. This is a measure of the average amount an investor can expect to win or lose per trade when executed according to the strategy. A positive expectancy, such as we see here, is a strong indicator that the strategy, if followed consistently, could be expected to be profitable over time.
Lastly, the System Quality Number (SQN) helps us rate the quality of the trading system. With an SQN of 2.54, we’re looking at a ‘good’ system that can be expected to perform well, assuming market conditions remain similar to those encountered in the backtest period.
Conclusion
In conclusion, the monthly seasonality trading strategy applied to T-Mobile US, Inc. (TMUS) presents a compelling argument for investors who are looking to incorporate temporal patterns into their investment approach. Through the meticulous analysis of historical data and key performance metrics, we’ve uncovered a strategy that not only boasts an impressive return but also demonstrates a strategic and disciplined use of market exposure to enhance profitability while managing risk.
The strategy’s success, as evidenced by an annualized return that significantly outperforms the buy-and-hold benchmark, is a testament to the potential of leveraging seasonality in the stock market. It showcases the power of timing and selective participation in the market, which can lead to outsized gains without the need to remain continuously invested.
However, it is imperative for investors to understand that past performance is not a guarantee of future results. Market conditions evolve, and what has worked in the past may not always apply moving forward. Therefore, this strategy should be integrated thoughtfully within a broader, diversified investment plan that takes into account an individual’s risk tolerance and financial goals.
The combination of a high win rate, controlled drawdowns, and a strong profit factor underscores the effectiveness of this seasonal strategy. Yet, the prudence of risk management and an awareness of potential drawdowns cannot be overstated. The reduced market exposure and the strategy’s ability to mitigate severe downturns can be particularly attractive to the risk-averse investor.
Ultimately, the monthly seasonality trading strategy for T-Mobile US, Inc. has proven to be robust over the backtesting period, but investors should remain vigilant and adaptable. The market is an ever-changing environment, and strategies must be reviewed and adjusted accordingly. This strategy stands as a shining example of how a well-researched, historical pattern-based approach can lead to significant growth in an investor’s portfolio, providing a structured path to potentially capitalize on the seasonality of the stock market.

“Make the invisible visible. My goal is to shine a light on the subtle seasonal signals in the stock market, providing investors with the insight needed to make informed decisions. By breaking down the complexities of seasonality, I strive to empower our audience with knowledge and foresight, turning data into action.”