


Introduction
As seasons change, so too does the landscape of the stock market. The shifts in weather patterns, consumer behavior, and corporate performance throughout the year can influence market trends and create opportunities for savvy investors. Recognizing and understanding these seasonal trends in the stock market can be a powerful tool for traders, allowing them to make informed decisions that align with historical patterns of performance.
In this blog post, we will explore the concept of seasonality in the stock market, specifically focusing on a trading strategy that looks to harness the recurring patterns within certain months of the year. This approach, while simple in its premise, can uncover hidden rhythms in the market’s performance and offer strategic entry points that may lead to superior returns compared to traditional investment strategies.
The discussion ahead will not only illuminate the potential advantages of trading based on seasonality but also provide a comprehensive analysis of how this strategy has historically fared, its risk profile, and the nuances of trade performance. Whether you’re a seasoned trader or just beginning to navigate the financial markets, understanding the role of seasonality could unlock new pathways to investment success. Join us as we unpack the intricacies of a seasonal trading strategy that could add a new dimension to your trading repertoire.
Company Overview
U.S. Bancorp (USB), headquartered in Minneapolis, Minnesota, is a prominent financial holding company with a rich history dating back to 1863. The company operates through its primary subsidiary, U.S. Bank, which is the fifth-largest commercial bank in the United States by assets. USB offers an extensive range of financial products and services, including personal and corporate banking, wealth management, payment solutions, and capital markets services. Catering to individuals, small businesses, corporations, and institutional clients, U.S. Bank has a vast network of branches and ATMs spread across the country, along with a robust digital banking platform. Its revenue streams are diversified, primarily comprising net interest income, non-interest income (including service charges, fees, and commissions), and trading and investment gains. USB’s value proposition lies in its commitment to customer satisfaction, financial strength, and innovation in banking technology. Employing a relationship-centric banking model, USB emphasizes building long-term connections with clients, catering to their evolving financial needs. The company’s growth strategy revolves around organic expansion, strategic acquisitions, and continuous enhancement of digital capabilities. Operating in the highly competitive banking industry, USB faces challenges from both traditional and emerging fintech companies. However, its strong brand recognition, customer-centric approach, and diversified revenue streams position it well to navigate industry dynamics and maintain its position as a leading financial services provider.
Strategy Overview
In the intricate dance of the stock market, timing can be as crucial as the stocks one selects. Today, we delve into a trading strategy that plays on the cadence of calendar months, specifically applied to U.S. Bancorp, a leading financial institution.
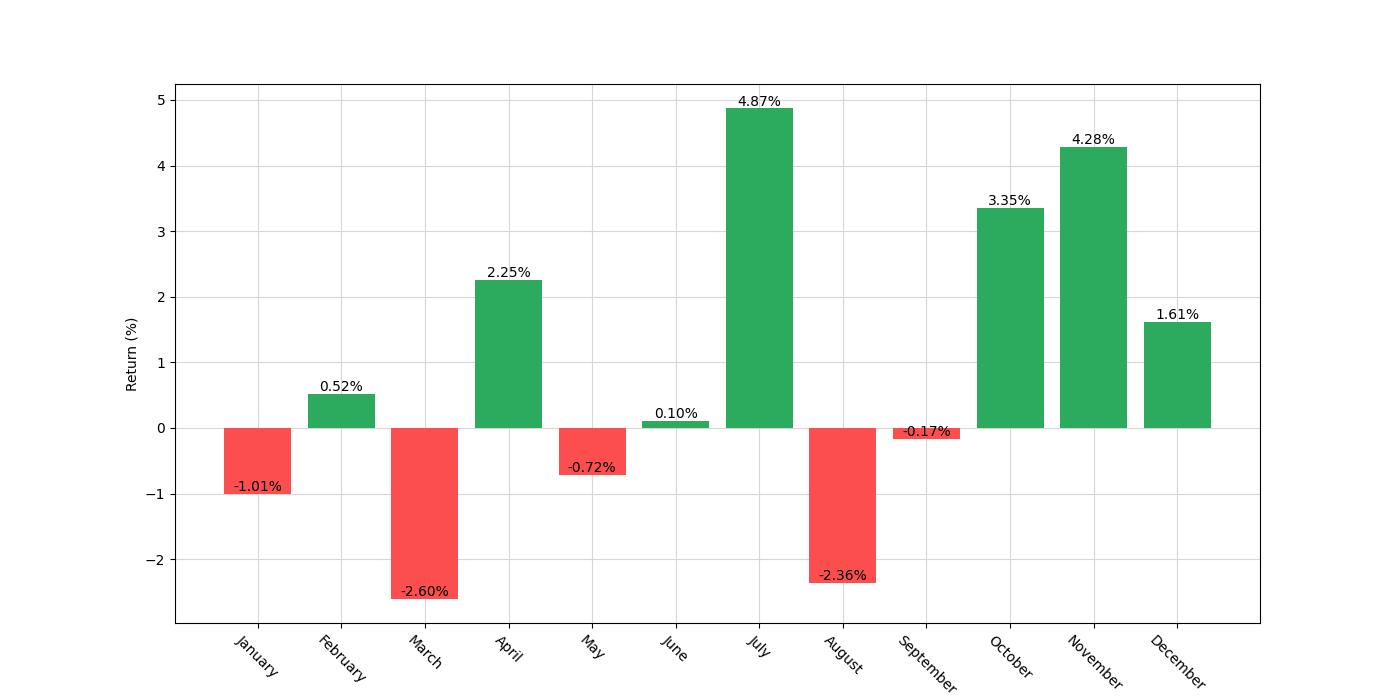
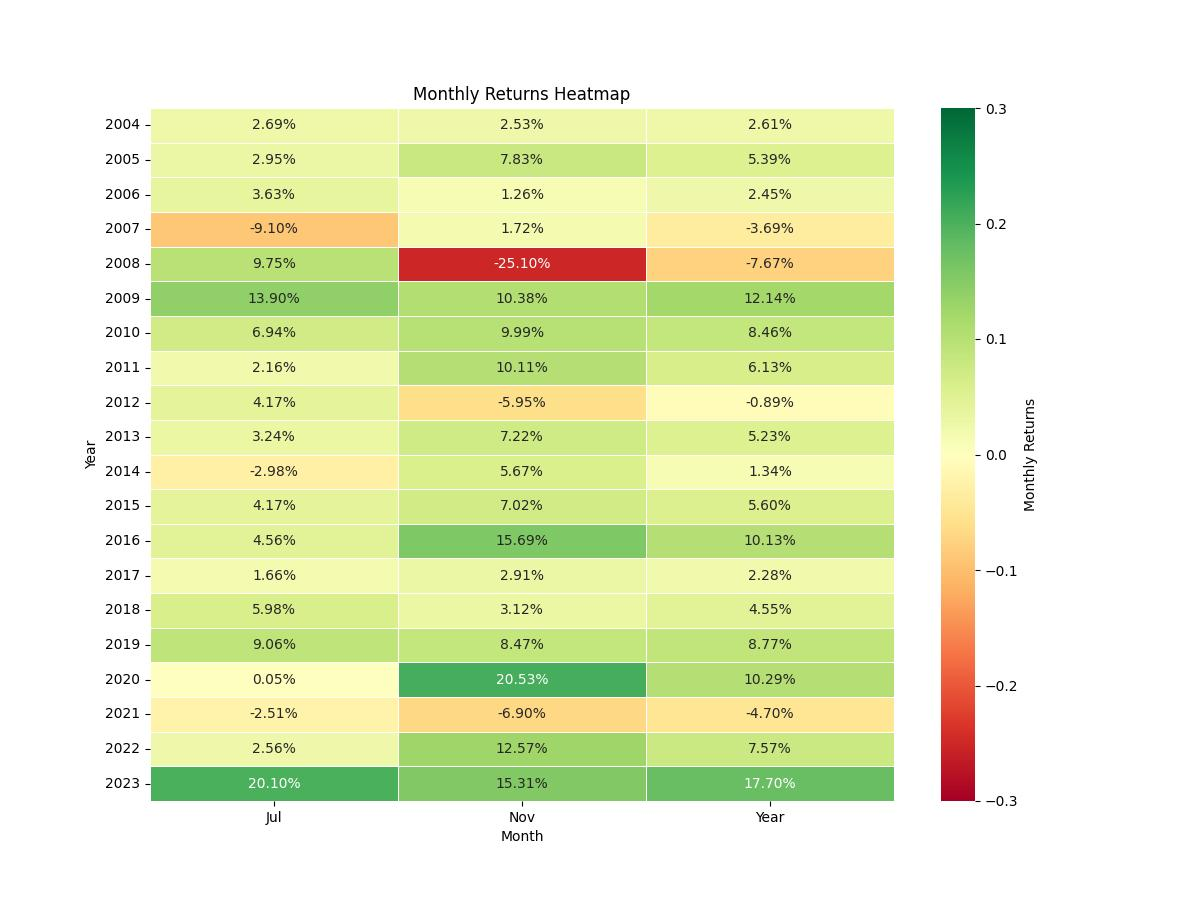
Our voyage through the temporal landscape of the stock market begins in the early days of 2004 and traverses nearly two decades to the close of 2023. Over this substantial period, a strategy was applied that operates on a simple premise: to enter a long position—a bet that the stock’s price will rise—during the months of July, October, and November. This approach is derived from historical patterns that suggest a recurring seasonality effect during these months. It is noteworthy that the strategy does not engage in short positions—bets that the stock’s price will fall—at any point.
The essence of this temporal strategy is its selective market exposure. Rather than being constantly active, the strategy is only in play for approximately 26% of the time, embodying the adage that sometimes, less is more. This focused approach allows for a strategic deployment of capital, with an initial investment of $10,000 poised to interact with the market’s ebb and flow.
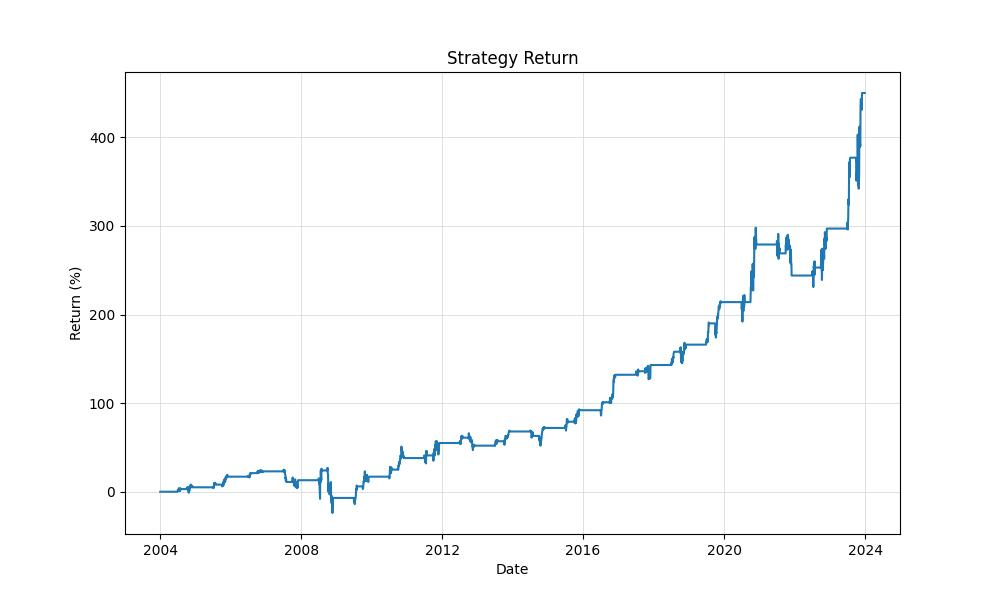
While the strategy does not incorporate factors such as transaction fees or slippage—variances between expected and actual transaction prices—its backtesting results offer a compelling narrative. Through its disciplined and cyclical entries into the market, the strategy has steered the initial capital to a commendable pinnacle, with the final equity standing at $54,983.55.
When we juxtapose these figures against the traditional ‘buy and hold’ approach—where an investor would simply purchase stock and retain it throughout the same period—the merits of this strategy become even more pronounced. The ‘buy and hold’ approach would have yielded a return of approximately 178.85%, a stout performance by conventional standards. Yet, the seasonal strategy outpaces this, boasting an impressive return of nearly 449.84%, a testament to the potency of aligning trades with historical seasonal trends.
The annualized return—a way of understanding the average yearly return if the performance were smoothed out over each year—further underscores the strength of our seasonal strategy. It sits at 8.91%, a robust figure that is sure to catch the discerning eye of any investor looking to optimize their portfolio’s performance.
It’s important to underscore that this strategy, with its calculated seasonal entries, has crafted a narrative of growth over the near two-decade backtesting period. It’s a narrative that not only highlights the potential of strategic timing but also offers a beacon for investors navigating the oft-turbulent waters of the stock market. It is a reminder that in the grand theatre of trading, timing one’s moves to the rhythm of the market can be as crucial as the moves themselves.
Key Performance Indicators
Investors often seek to understand the viability of a trading strategy by examining its historical performance. In the case of the U.S. Bancorp (USB) monthly seasonality trading strategy, a backtest spanning from January 2, 2004, to December 29, 2023, paints a vivid picture of how this approach has fared over time.
The strategy’s initial capital was set at $10,000, and over the course of nearly two decades, it has yielded a remarkable growth, culminating in an equity final balance of $54,983.55. This figure represents the ending balance of the account after all trading activity, signifying a 449.84% return on the initial investment. Such a substantial increase is noteworthy, especially when compared to the strategy’s buy and hold counterpart, which delivered a return of 178.85% over the same period. This stark contrast highlights the potential benefits of a more active trading approach based on seasonality.
To put these returns into an annual perspective, the strategy’s annualized return stands at 8.91%, a robust figure suggesting that the strategy not only provided significant gains but did so on a consistent basis year over year. When juxtaposed with the annualized return of the buy and hold strategy, which is 5.36%, the monthly seasonality strategy’s superior performance becomes even more evident.
In terms of the strategy’s overall equity growth, the peak equity reached was also $54,983.55, aligning with the equity final balance. This indicates that the strategy ended on a high note, with the account balance at its maximum at the conclusion of the backtesting period.
Investors might draw confidence from the strategy’s demonstrated ability to grow capital over time. The impressive final equity, the substantial total return relative to the initial investment, and the favorable annualized return all suggest that this seasonality-based approach to trading U.S. Bancorp has borne fruit in the historical test period. These results could potentially spark interest in investors who aim to capitalize on seasonal patterns within the stock market.
Risk Management
When considering a trading strategy, it’s imperative to weigh the potential rewards against the inherent risks. A prudent investor understands that managing risk is as crucial as identifying opportunities for growth. In the case of the seasonal trading strategy applied to U.S. Bancorp (USB), we have a variety of metrics that help us evaluate the risk profile of the strategy over the backtesting period from January 2, 2004, to December 29, 2023.
Firstly, let’s talk about annual volatility, which measures the extent to which the strategy’s returns deviate from their average over a year. The annual volatility for this strategy stands at approximately 16.88%. To put this into perspective, lower volatility is typically synonymous with lower risk, and in this case, the strategy demonstrates moderate fluctuations in returns when compared to the broader market or more volatile securities.
In evaluating the quality of the strategy’s returns, we turn to the Sharpe Ratio, which is a measure of risk-adjusted return. Sharpe Ratio takes the strategy’s returns above the risk-free rate and divides them by the volatility. The closer this number is to 1 or above, the better the risk-adjusted return. Our strategy holds a Sharpe Ratio of about 0.528, which suggests that the excess returns are somewhat moderate in relation to the risk taken. While not exceptional, this indicates that the strategy does provide a level of compensation for the incurred volatility.
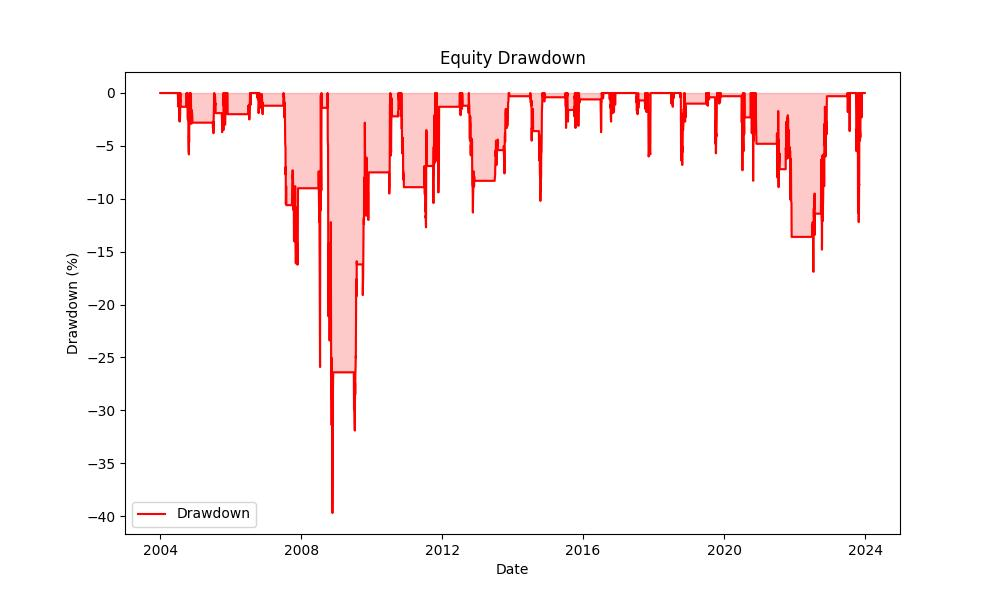
A critical consideration for any investor is the maximum drawdown experienced by the strategy. This reflects the largest peak-to-trough drop in the account value and is a vital indicator of downside risk. For this trading approach, the maximum drawdown was -39.68%, a significant decline, which could test the mettle of many investors. However, this needs to be viewed in the context of the strategy’s overall performance and time horizon.
Furthermore, the average drawdown, sitting at -3.11%, provides insight into the typical declines from a peak before a rebound, offering a sense of the ‘ebb and flow’ of the strategy’s performance. The average drawdown duration of 60 days indicates that the strategy typically recovers from its drawdowns within two months, which is relatively quick and may be palatable for investors with a medium-term outlook.
The maximum drawdown duration is a stark reminder of the potential for extended periods of underperformance, with the longest drawdown lasting 951 days. This duration would require investors to maintain their conviction in the strategy through almost three years of value decline before a recovery, a testament to the need for patience and long-term commitment.
Trade Analysis
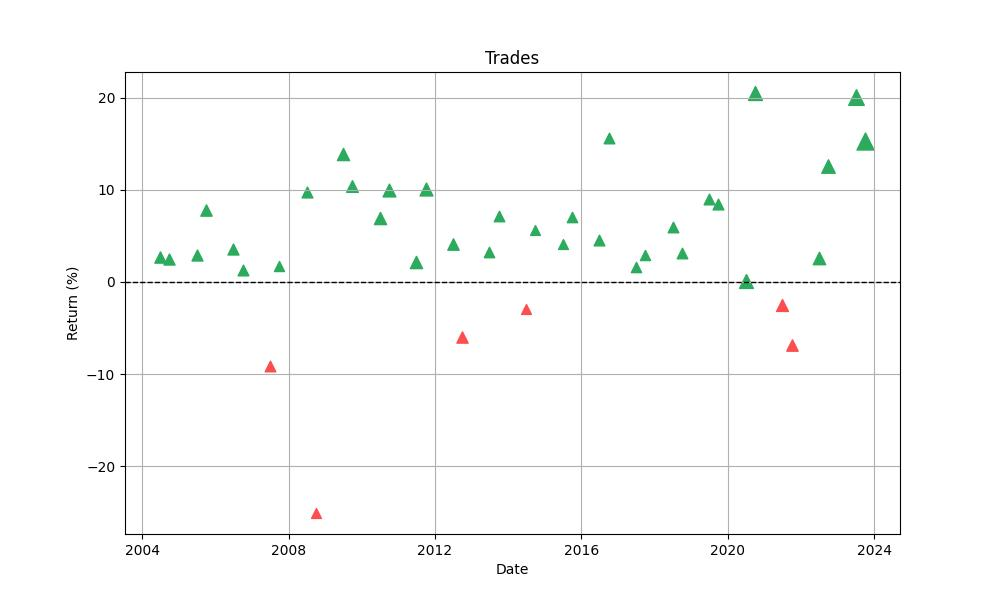
In the pursuit of optimizing investment returns, the analysis of trade performance is paramount. The monthly seasonality trading strategy applied to U.S. Bancorp (USB) offers intriguing insights. Over the course of the backtesting period, which spans from January 2nd, 2004, to December 29th, 2023, a total of 40 trades were executed based on the specified long positions during the months of July, October, and November.
What stands out is the high win rate of 85%. This figure indicates that the strategy was successful in 34 out of the 40 trades, showcasing the efficacy of the chosen seasonal months for entering long positions. This level of consistency is a promising indicator for investors who seek strategies with a track record of regular positive outcomes.
When we delve into the extremities of trade performance, we notice that the best trade yielded an impressive 20.53% return. On the flip side, the strategy was not without its setbacks—as the worst trade recorded a significant loss at -25.10%. Despite this, the average trade yielded a positive 4.36% return, which is a testament to the strategy’s ability to recover from losses and capitalize on the seasonal tendencies of USB.
The duration metrics of the trades provide further context to the strategy’s performance. The longest trade spanned over 63 days, while on average, trades were held for 46 days. This duration aligns well with the strategy’s monthly approach, as it allows for the capture of seasonal trends within the span of one to two months.
Another critical metric is the Profit Factor, which, at 4.57, affirms the strategy’s profitability by comparing the gross profits to the gross losses. A Profit Factor greater than one suggests that the strategy is generating more money on winning trades than it is losing on the bad ones, which is a strong sign of a potentially sustainable approach to trading.
Lastly, the Expectancy of 4.68% provides us with an average value of how much the strategy can expect to make on each trade. This positive expectancy, when considered alongside the high win rate and Profit Factor, paints a picture of a strategy that has the potential to offer consistent gains over time.
While past performance is not indicative of future results, the backtesting data provides a window into the strategy’s resilience and potential. Investors who value consistency, manageability, and a methodical approach may find such an analysis to be a guiding light in the often unpredictable currents of the stock market.
Conclusion
As our journey through the seasonality of the stock market and the examination of a meticulously crafted trading strategy comes to a close, we find ourselves armed with a wealth of insights. The U.S. Bancorp seasonality strategy has delineated a clear path of historical performance, demonstrating the profound impact that strategic timing can have on investment outcomes. With nearly two decades of data at our disposal, we have observed how selective market engagement during historically opportune months can significantly outperform a traditional ‘buy and hold’ strategy.
However, beyond the impressive returns and peaks in equity, the true value of this strategy lies in the story it tells about risk and reward. The data has shown us that while there are periods of volatility and drawdowns, a disciplined approach, coupled with an understanding of seasonal market trends, can lead to a robust annualized return and a healthy risk-adjusted performance.
It is imperative for investors to recognize both the potential and the perils that come with any trading strategy. The success of this seasonal approach does not negate the need for risk management and a long-term perspective. The journey of investing is as much about withstanding the troughs as it is about reaching the peaks.
As we reflect on the various facets of this strategy—from the striking percentage of winning trades to the quick recovery from average drawdowns—it becomes evident that a well-conceived plan that leverages historical market patterns can be a powerful tool in the investor’s arsenal. The combination of high win rates, favorable profit factors, and positive trade expectancy presents a compelling case for the efficacy of this seasonal strategy.
While we must always exercise caution and not assume that history will repeat itself exactly, this strategy offers a beacon of what is possible when one marries meticulous analysis with disciplined execution. The success of the U.S. Bancorp seasonality strategy serves as a testament to the potential of harnessing the rhythmic patterns of the market to one’s advantage.
As investors, our quest is to navigate the shifting tides of the stock market with acumen and foresight. The insights gleaned from this strategy have illuminated a path that, while not without its challenges, has the potential to guide us toward prosperous shores. In the end, the wisdom of this approach resonates with the timeless truth that in the realm of investment, as in nature, there is a season for everything—a season to sow, a season to reap, and if done wisely, a season to celebrate the fruits of one’s labor.

“Make the invisible visible. My goal is to shine a light on the subtle seasonal signals in the stock market, providing investors with the insight needed to make informed decisions. By breaking down the complexities of seasonality, I strive to empower our audience with knowledge and foresight, turning data into action.”