


Introduction
In the intricate dance of the stock market, where each step can lead to either a rise in fortune or a tumble into uncertainty, investors are constantly seeking patterns and rhythms that can guide their decisions. The concept of seasonality in the stock market offers a fascinating rhythm that, if understood and applied with precision, can become an instrumental part of an investor’s strategy.
As we delve into the world of strategic market timing, we find that the ebb and flow of stocks are not purely random but often follow subtle seasonal trends. These trends can be harnessed to create trading strategies with the potential to significantly outperform more static investment approaches. But how does one navigate these cyclical patterns, and what evidence do we have that a strategic approach to seasonality can truly enhance investment outcomes?
In the forthcoming sections, we will explore the intricacies of a trading strategy that does not just follow the calendar but listens to the market’s seasonal whispers. We will dissect the performance, risk management, and trade analysis of a decade-long seasonality trading strategy applied to Veeva Systems Inc., a company whose stock has not wandered aimlessly through the years but has shown a discernible pattern tied to the calendar months.
Join us as we journey through the data and decisions that underpin this seasonal strategy, gleaning insights that could illuminate the path for investors looking to add a temporal edge to their investment strategy. Let’s turn the pages of market history to understand how a disciplined approach to seasonality might offer a compelling alternative to the traditional buy-and-hold mantra, providing a beacon for those navigating the shifting tides of the stock market.
Company Overview
Veeva Systems Inc. (VEEV), a leading cloud-based software solutions provider for the life sciences industry, empowers businesses with innovative tools to enhance efficiency, productivity, and compliance. The company’s cloud-based platform offers a suite of products tailored for various functions within life sciences organizations, including commercial, clinical, data management, and quality assurance. Veeva’s customer base includes pharmaceutical and biotechnology companies, medical device manufacturers, and contract research organizations. Its revenue streams stem from subscription fees for its software products and professional services, including implementation, consulting, and training. Veeva’s value proposition lies in its ability to streamline processes, improve collaboration, and ensure regulatory compliance, resulting in cost reduction and improved profitability for its clients. The company’s operational model emphasizes continuous innovation and customer-centricity, driving its growth strategy. Veeva operates in a dynamic and growing industry, characterized by increasing demand for digital transformation and data-driven insights in the life sciences sector. The company’s strong financial performance, loyal customer base, and commitment to innovation position it well for sustained growth in the years to come.
Strategy Overview
When it comes to astute investing, timing can be nearly as crucial as the stock selection itself. For the retail investor seeking an edge in the markets, understanding the rhythm of a company’s stock performance throughout the year can offer invaluable insights. In this regard, we’ve conducted an in-depth backtest of a monthly seasonality trading strategy focusing on Veeva Systems Inc., a leader in cloud-based software solutions for the life sciences industry.
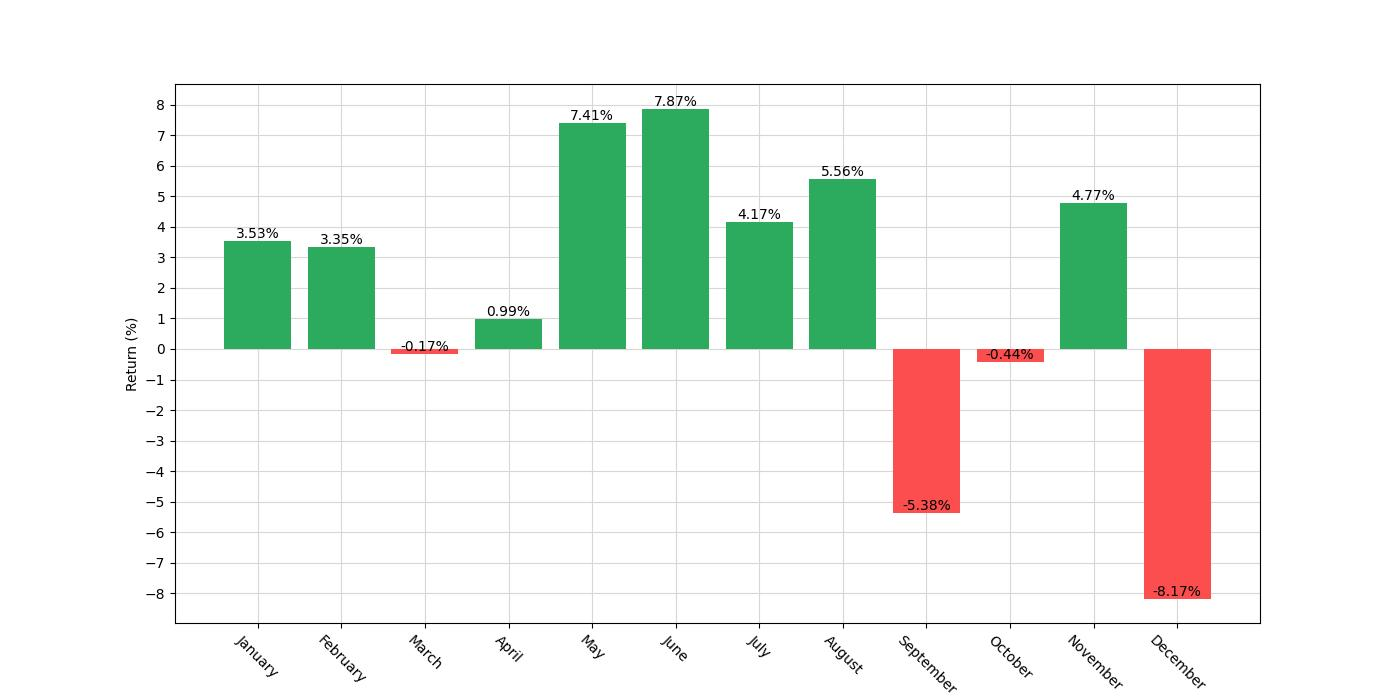
Our strategy was straightforward yet disciplined; we took a long position in VEEV during months historically favorable to the stock — specifically, January, February, May, June, July, and November. Conversely, we initiated short positions during September and December, periods that our research suggested were less advantageous for holding VEEV shares.
The backtest spanned over a decade of market activity, starting from October 16, 2013, and concluding on December 29, 2023. This duration of 3726 days provided a robust dataset from which to draw meaningful conclusions. During this period, our strategy was in the market, meaning either in a long or short position, approximately 59.44% of the time. This level of market exposure strikes a balance, allowing investors to capitalize on identified seasonal trends while mitigating the risk of being overly exposed to market volatility during non-seasonal periods.
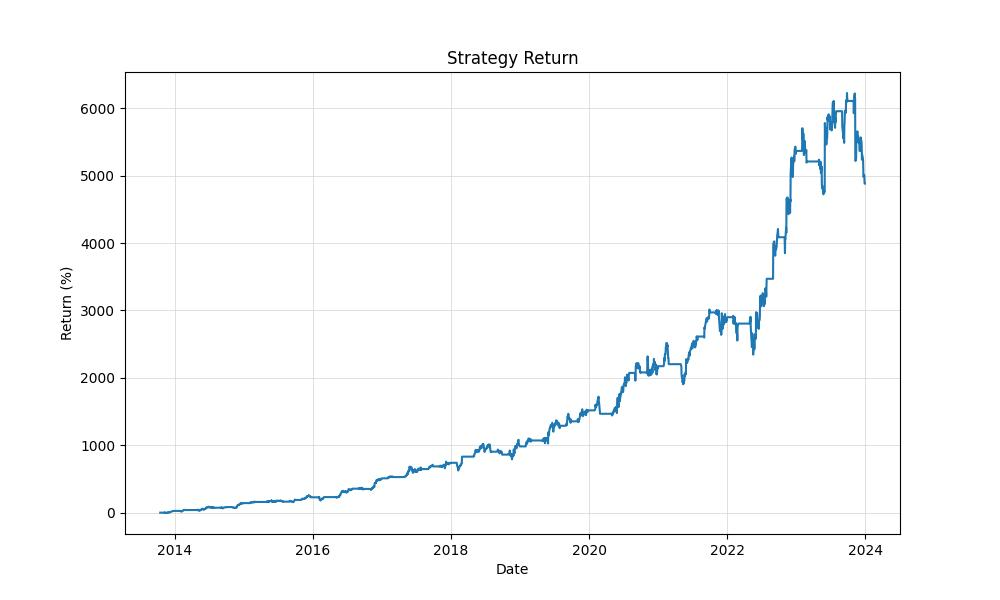
The efficacy of this seasonal approach is underscored by the remarkable growth of the initial capital. Starting with $10,000, the strategy’s ending equity was a staggering $498,065.56, with an equity peak reaching $632,563.72. To put this growth into perspective, the strategy yielded an astronomical return of 4880.66%, dwarfing the buy & hold return of 418.08%. On an annualized basis, the strategy’s return stood at 46.72% — an impressive feat by any standard.
For retail investors, the implication of these findings is clear: by understanding and leveraging the seasonal tendencies of VEEV’s stock performance, one could have significantly outperformed a simple buy and hold strategy over the same period. It’s important to note that the results of this backtest did not account for potential trading costs such as commissions and slippage, which can affect net returns. However, the outsized gross returns suggest that even after accounting for such costs, the strategy would likely have remained highly profitable.
Key Performance Indicators
Veeva Systems Inc., with its specialized cloud solutions for the life sciences industry, has been a compelling subject for investors aiming to capitalize on market seasonality. The backtesting results of a monthly seasonality trading strategy on Veeva Systems Inc. reveal intriguing insights into the performance of such a strategy over a substantial period, from October 16, 2013, to December 29, 2023.
The strategy’s performance, when measured by the final equity value, shows a remarkable growth from an initial capital of $10,000 to an impressive $498,065.56. This stands in stark contrast to the equity final value of $46,578.4 for a simple buy-and-hold approach over the same period. It’s clear that the seasonal trading strategy has not only outperformed but also significantly amplified the potential returns for investors.
Delving deeper, the equity peak reached during the strategy implementation was $632,563.72, indicative of the strategy’s potential during optimal market conditions. This peak surpasses the equity peak of the buy-and-hold strategy, which was $81,856, further underscoring the efficacy of the seasonal approach.
The overall return of the strategy is an eye-opening 4880.66%, dramatically overshadowing the buy-and-hold return of 418.08%. When annualized, the return for the seasonal strategy stands at 46.72%, a figure that robustly positions it ahead of the annualized buy-and-hold return of 16.29%. This demonstrates the power of strategic seasonal trading in harnessing the cyclical nature of the stock market to generate substantial gains.
The data paints a clear picture: by adhering to a disciplined approach that capitalizes on the historically favorable months for Veeva Systems Inc., the trading strategy has not only generated extraordinary returns but has also enhanced the growth trajectory of the investment compared to the traditional buy-and-hold strategy. These numbers serve as a testament to the potential of integrating seasonality into investment strategies, offering a compelling alternative for investors in their quest to maximize returns in the stock market.
Risk Management
Navigating the stock market’s unpredictable currents requires not just a strategic compass but also a robust life jacket to safeguard one’s investments. This is where the fine art of risk management comes into the picture. It’s about understanding the inherent volatility that comes with trading and having measures in place to minimize losses when the market’s tides turn unexpectedly. Let’s dive into the nitty-gritty of how our monthly seasonality trading strategy for Veeva Systems Inc. holds up under the lens of risk management.
Risk in the stock market is often synonymous with volatility—the degree of variation of trading prices over time. For our strategy, the annualized volatility stands at 43.56%. To put it into perspective, this number provides us with a sense of the strategy’s stability—or lack thereof. A higher volatility typically means a higher risk, as the value of the investment can swing dramatically in a short period, potentially leading to significant losses or gains.
To assess the performance of the trading strategy relative to its risk, we look at the Sharpe Ratio. With a score of 1.07, our strategy shows that the average return on the investment has exceeded the risk-free return (typically the return of a 3-month Treasury bill) by about 1.07 times the standard deviation of the return. A Sharpe Ratio greater than 1 is often considered acceptable to good by investors, indicating that the returns are commensurate with the risk taken.
Another vital aspect of risk management is understanding the drawdown, which represents the peak-to-trough decline during a specific record period of an investment. The maximum drawdown for this strategy was observed at -23.40%, which means that at its worst point, the value of the portfolio had dropped by nearly a quarter from its peak value. This figure is crucial for investors to consider because it provides a threshold for potential losses during the investment period.
However, the average drawdown was significantly lower, at -4.31%, indicating that while the strategy has experienced some valleys, they typically haven’t been as deep as the maximum drawdown suggests. The duration of these drawdowns is equally important. The longest period the strategy stayed in a drawdown was 267 days, while on average, the drawdown periods lasted just 28 days. Shorter drawdown durations can be a sign of a strategy’s resilience, as it suggests a quicker recovery from losses.
Understanding the risk associated with this trading strategy allows investors to make informed decisions about their capital allocation. It’s about striking a balance between the pursuit of returns and the tolerance for potential losses. While the backtesting results show periods of significant equity growth, they also reveal moments of downturn that must be weighed carefully. With this comprehensive view of the strategy’s risk profile, investors can better position themselves on the right side of market seasonality, harnessing the ebbs and flows to their advantage.

Trade Analysis
When navigating the tumultuous seas of stock trading, every investor yearns for insights that could provide them with a competitive edge. The meticulous backtest of a monthly seasonality trading strategy on Veeva Systems Inc. offers a compelling narrative that’s worth delving into.
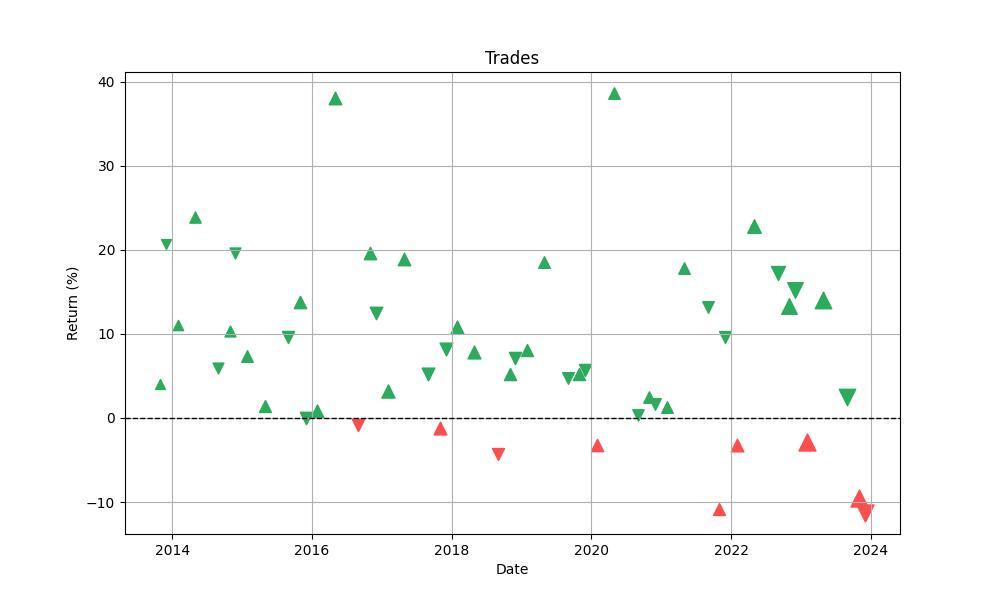
The strategy, which involved initiating long positions during the months of January, February, May, June, July, and November, and short positions in September and December, has been applied to Veeva Systems over a span of approximately ten years. During this period, a total of 52 trades were executed. The robust number of trades provides us with a substantial dataset to analyze the strategy’s effectiveness over time.
A standout figure in this analysis is the win rate, which stands at an impressive 82.69%. This high percentage signals a strong alignment between the seasonal strategy and Veeva Systems’ stock performance, indicating that the strategy has been consistently successful in predicting the stock’s directional movement over the specified months.
Digging deeper into the individual trades, we find that the best trade yielded a remarkable return of 38.66%. Such a high number highlights the potential of this trading strategy to capitalize on strong market movements. Conversely, the strategy’s resilience is tested by its worst trade, which resulted in an 11.30% loss. This figure, while noteworthy, is dwarfed by the success of the best trade, suggesting that the strategy, while not infallible, has the capacity to recover from downturns effectively.
The average trade return of 7.81% further cements the strategy’s efficacy. It indicates that, on average, each trade made under this strategy has contributed positively to the overall portfolio’s growth. Additionally, the duration of trades tells its own story: the longest trade lasted 94 days, while the average duration was 42 days. These durations reflect the medium-term nature of this seasonal strategy, pointing to a balanced approach between short-term volatility and long-term investment horizons.
The profit factor, a metric that compares the total value of winning trades to the total value of losing trades, stands at an impressive 10.11. This number is indicative of a highly profitable strategy, as the gains from winning trades are more than ten times the losses from losing trades—a reassuring sign for any investor considering this approach.
Lastly, the expectancy of 8.29% provides the average expected return on any trade placed within the strategy. It is a crucial figure for investors as it encapsulates the strategy’s performance, considering both wins and losses, and offers a glimpse into the potential future returns.
The data presented paints a picture of a well-structured strategy that, when backtested against Veeva Systems Inc.’s historical performance, suggests the possibility of substantial gains with managed risk. It’s a testament to the power of a disciplined, data-driven approach in the pursuit of stock market profits.
Conclusion
In conclusion, our exploration into the seasonal patterns of Veeva Systems Inc.’s stock performance has provided compelling evidence that a strategic, disciplined approach to investing can yield significant returns. By harnessing the cyclical trends evident over the past decade, our monthly seasonality trading strategy has demonstrated the potential to vastly outperform traditional buy-and-hold strategies. The backtested data reveals exceptional growth in equity, a high win rate, and robust profit factors that underscore the effectiveness of trading with the seasons.
However, it’s paramount to acknowledge that no strategy is without risk. Our analysis has brought to light the volatility and drawdowns associated with this seasonal approach. While the strategy’s high Sharpe Ratio and quick recovery from drawdowns are reassuring, investors must still evaluate their risk tolerance against the backdrop of potential market shifts.
The results of this comprehensive study are not just numbers on a page. They are a beacon for retail investors navigating the complexities of the stock market. By understanding the power of seasonality, investors are better equipped to make informed decisions that align with their financial goals and risk appetite. While past performance is not indicative of future results, the strategic insights gleaned from Veeva Systems Inc. offer a promising perspective on the potential of seasonal trading strategies.
As we draw the curtain on this analysis, it’s clear that the integration of seasonality into an investment portfolio can be a game-changer. For those willing to embrace the nuances of market timing and conduct thorough research, the rewards can be substantial. This journey through the ebb and flow of Veeva Systems Inc.’s stock performance is a testament to the adage that in the world of investing, timing is indeed everything.

“Make the invisible visible. My goal is to shine a light on the subtle seasonal signals in the stock market, providing investors with the insight needed to make informed decisions. By breaking down the complexities of seasonality, I strive to empower our audience with knowledge and foresight, turning data into action.”