


Introduction
As investors, we are perpetually in search of the Holy Grail of trading strategies, one that can weather the market’s vicissitudes and deliver consistent returns. The concept of seasonality presents a fascinating dimension to this quest. Seasonal trends in the stock market can often be as predictable as the change of seasons in nature, and harnessing these patterns could unlock novel avenues for profitability.
In this blog post, we unravel the mysteries of market seasonality by spotlighting a trading strategy tailored to the rhythms of Weyerhaeuser Company, a stalwart in the timberlands sector. We will dissect the mechanics of a strategy that has stood the test of time, spanning nearly two decades of financial seasons, to provide you with a blueprint for capitalizing on the cyclical ebbs and flows that characterize this industry giant’s stock performance.
Our exploration begins with an in-depth analysis of a strategy that plays on the historical monthly performance trends of Weyerhaeuser’s stock, guiding you through the nuances of entry and exit points that have been historically advantageous. By marrying rigorous backtesting with a keen understanding of seasonal market dynamics, we aim to present a narrative that is as informative as it is actionable, equipping you with the knowledge to make informed decisions in the seasonally affected marketplace.
Join us on this journey through time and trends as we navigate the seasonality of the stock market with precision and insight, providing a lantern in the often-opaque world of trading strategies. Whether you are a seasoned trader or a curious newcomer, this post promises to elevate your understanding of how the seasons can influence stock performance and how to potentially profit from these patterns.
Company Overview
Weyerhaeuser Company, a leading global forest products company, stands tall as a titan in the realm of timberlands, wood products, and cellulose fibers. Established in 1900, Weyerhaeuser’s legacy is deeply rooted in sustainable forest management, spanning 23 million acres of timberland across the United States. The company’s core products encompass lumber, plywood, oriented strand board (OSB), and cellulose fibers, catering to diverse markets ranging from construction and manufacturing to packaging and consumer goods. Weyerhaeuser’s revenue streams flow primarily from the sale of these products, complemented by real estate development and timber sales. Its value proposition lies in its commitment to sustainable forestry practices, ensuring a steady supply of high-quality raw materials while preserving ecological integrity. Weyerhaeuser’s operational model emphasizes efficiency and innovation, with a focus on optimizing production processes and leveraging technology to enhance productivity. The company’s growth strategy hinges on expanding its global footprint, diversifying product offerings, and capitalizing on emerging market opportunities. Operating in a dynamic and competitive industry, Weyerhaeuser navigates market fluctuations, regulatory changes, and evolving consumer preferences. Despite these challenges, the company’s unwavering dedication to sustainability and operational excellence positions it as a resilient player in the forest products sector.
Strategy Overview
In the dynamic world of stock trading, strategies that leverage seasonal trends can offer investors a unique edge. Let’s take a closer look at one such approach applied to Weyerhaeuser Company, a firm with a rich history in the timberlands industry. The trading strategy in question is grounded in the observed monthly seasonality of the company’s stock performance.
The backtesting period for this strategy stretches from the beginning of 2004 to the closing days of 2023, encompassing nearly 20 years of market activity. This extensive duration of 7301 days offers a robust temporal canvas for assessing the efficacy of the strategy.
In the realm of trading, exposure time is a critical metric, indicating the proportion of the total time period during which capital is at risk in the market. For this particular strategy, the exposure time is calculated to be approximately 25.69% of the total period. It is a measure of how actively the strategy engages with the market, reflective of a targeted approach rather than a constant market presence.
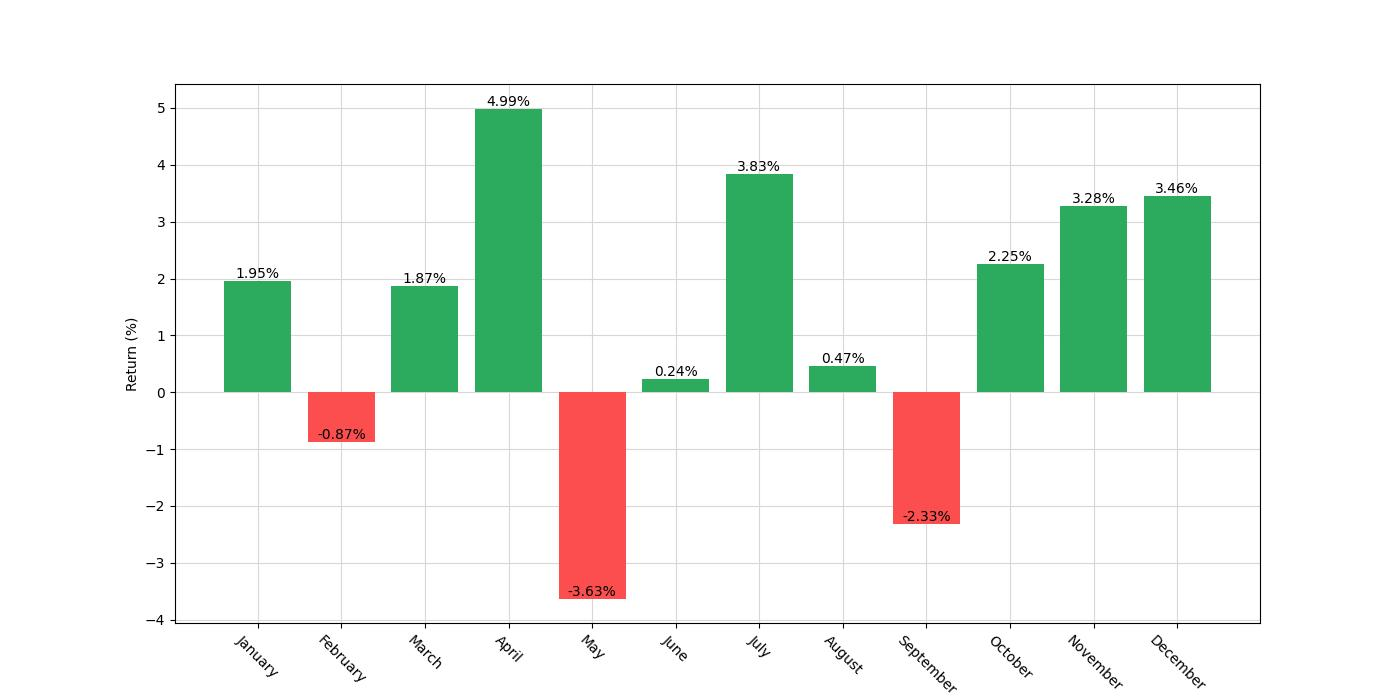
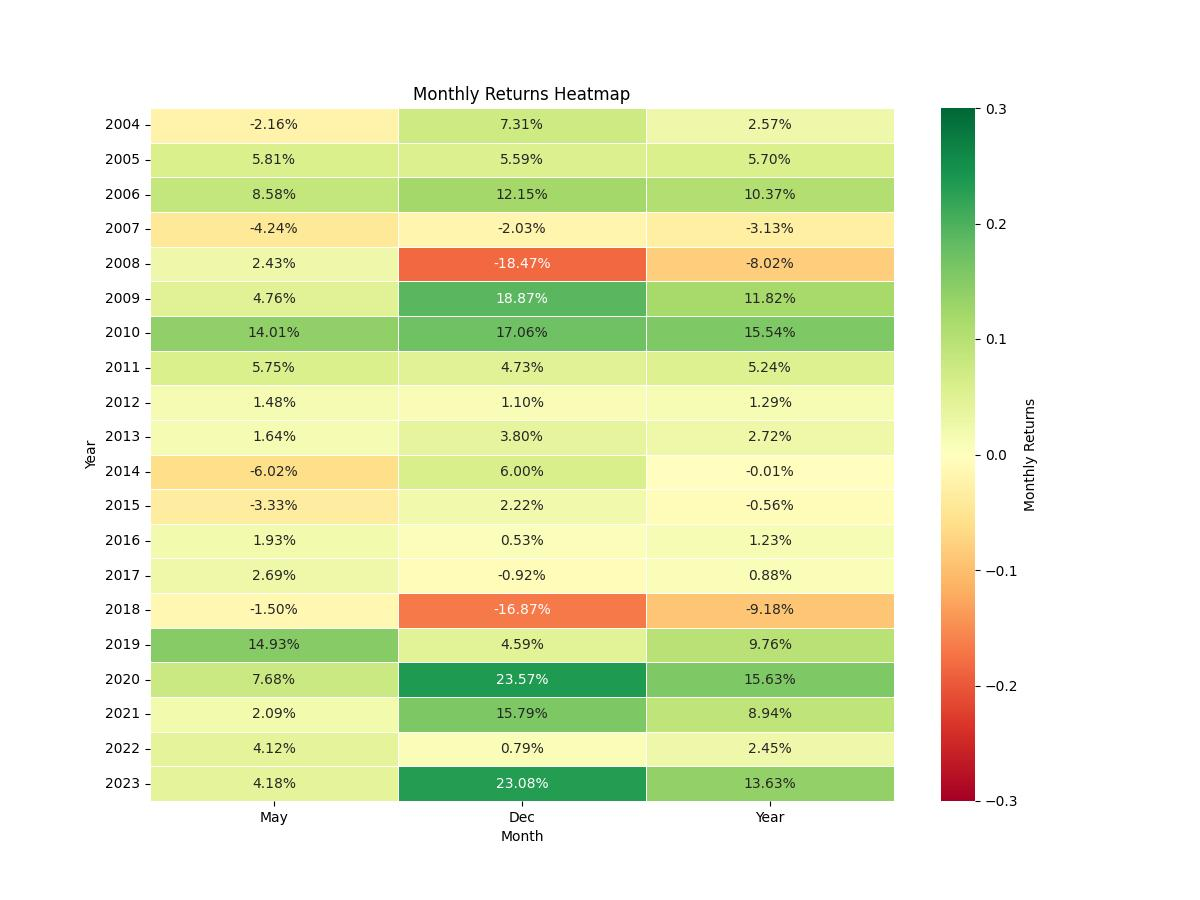
The core of the strategy is elegantly simple: it involves initiating a long position in Weyerhaeuser Company’s stock during the months of November and December and taking a short position in the month of May. The choice of these specific months is predicated on historical patterns in the stock’s performance, suggesting an uptick in value towards the year’s end and a potential decline as summer approaches.
It’s important to note that the backtesting results presented do not factor in commissions or slippage, which could alter the real-world outcomes of the strategy. However, the exclusion of these variables allows for a clearer analysis of the strategy’s raw performance.
In terms of initial investment, the strategy commences with a capital of $10,000. This figure serves as the baseline against which the performance of the strategy is measured, providing a tangible starting point for retail investors to understand the growth potential within the specified period.
This strategy overview sets the stage for us to delve deeper into the specific results of the backtest, including the final equity, peak equity, overall returns, annualized returns, and comparisons to a simple buy-and-hold approach. By understanding the structure and rationale behind the strategy, investors can better appreciate the subsequent analysis of its performance and risk management.
Key Performance Indicators
In the realm of investing, performance metrics are the compass by which we navigate the turbulent waters of the stock market. They enable us to quantify success, compare strategies, and refine our approach. When it comes to the seasonal trading strategy applied to Weyerhaeuser Company, a leader in the timber, land, and forest products sector, the numbers speak volumes about the effectiveness of timing the market based on historical monthly trends.
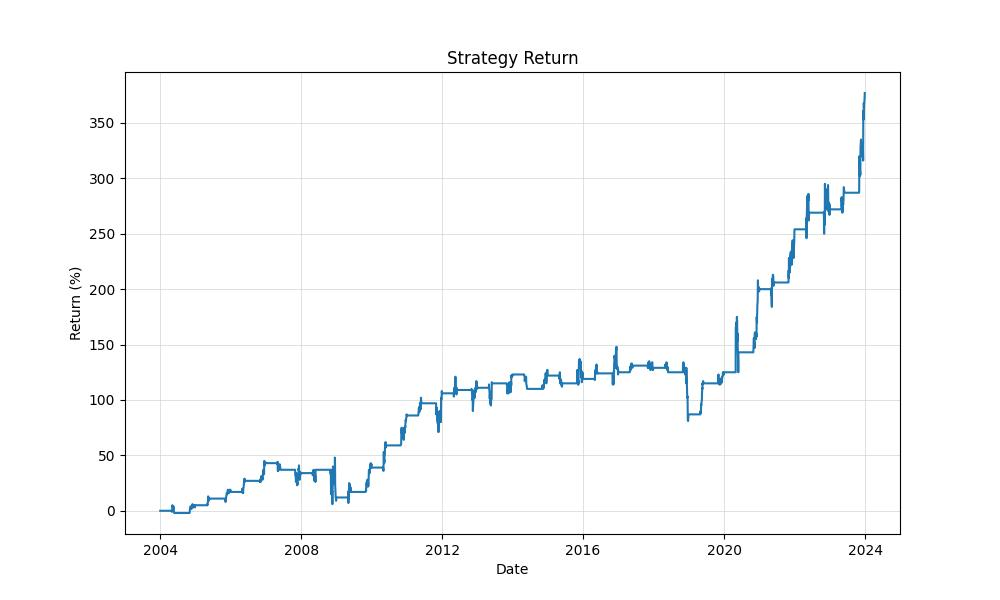
The initial capital invested in this strategy was $10,000. Over the course of nearly two decades, from January 2004 to December 2023, this investment blossomed to an impressive $47,653.54. To put this into perspective, the final equity achieved with this strategy was more than double the equity one would have from a simple buy-and-hold approach, which would have resulted in $28,302.06. This stark difference illustrates the potential benefits of an active trading strategy over a passive one.
The peak equity, which represents the highest value the investment reached, coincides with the final equity, underscoring a strategy that concluded on a high note without succumbing to subsequent downturns. This highlights not only a successful strategy but also the fact that the strategy’s most profitable periods were not fleeting but sustained.
Investors are often keen on understanding the overall return generated by a strategy. Our seasonality strategy yielded a return of 376.54%, dwarfing the 184.29% return of a buy-and-hold strategy. This substantial increase in return is even more impressive when we consider the annualized return, which stands at 8.13% for the seasonality strategy compared to a more modest 5.35% for the buy-and-hold approach.
However, returns alone can be an incomplete measure of a strategy’s success without considering the risks involved. In our analysis, we measure risk by examining the volatility of the annual returns. The seasonality strategy’s annual volatility was 17.27%, which is substantially less than the 35.81% experienced by the buy-and-hold strategy. This suggests that not only did the seasonality strategy outperform in terms of returns, but it also offered a smoother ride for investors, avoiding the more extreme ups and downs that characterize the stock market.
A strategy’s risk-adjusted return is encapsulated by the Sharpe Ratio, a metric that allows us to understand how much excess return we’re receiving for the extra volatility endured by holding a riskier asset. The seasonality strategy’s Sharpe Ratio was 0.47, compared to a much lower 0.15 for the buy-and-hold strategy. Although the seasonality strategy’s Sharpe Ratio is below the often-sought-after threshold of 1, it’s significantly higher than the buy-and-hold strategy, indicating a more favorable return per unit of risk.
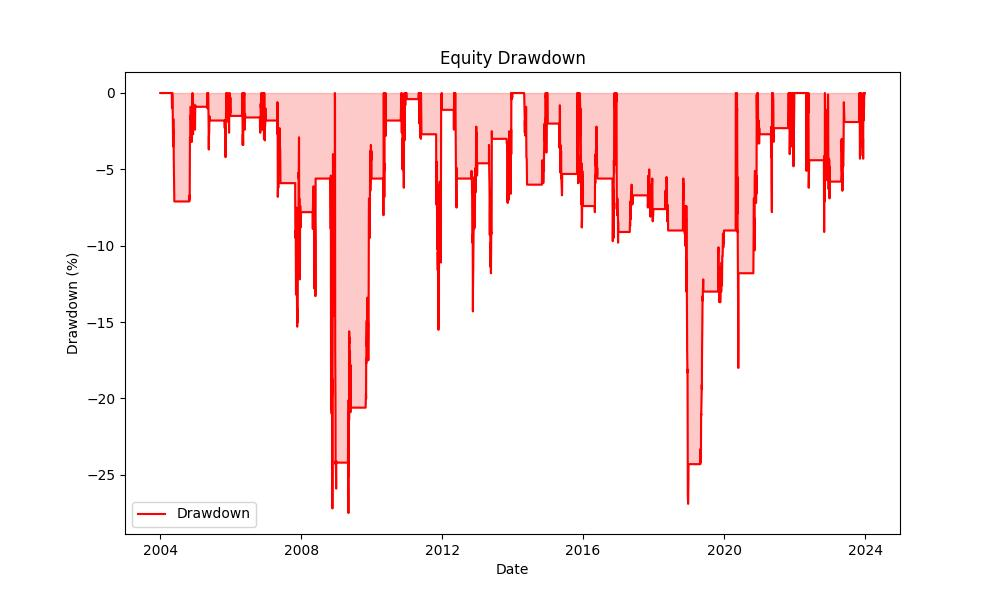
Lastly, we delve into drawdowns, which are peak-to-trough declines in investment value. For any investor, understanding drawdowns is vital as they test both financial resilience and emotional resolve. The maximum drawdown for the seasonality strategy was -27.46%, while the average drawdown was -4.82%. This contrasts with a dramatic -75.59% maximum drawdown for the buy-and-hold approach. The average duration of these drawdowns was 106 days for the seasonality strategy, substantially less than the 2052 days, which is a staggering period for the buy-and-hold strategy’s maximum drawdown duration.
Risk Management
In the world of investing, the adage “no risk, no reward” often rings true, but understanding and managing that risk is what separates the seasoned investor from the novice. When we dive into the seasonality trading strategy of Weyerhaeuser Company (WY), we’re not just talking about the potential for profit—equally important is how we navigate through the market’s inevitable ebb and flow.
The annualized volatility of this strategy sits at 17.27%, a figure that encapsulates the level of variability in the returns. This may sound high, but it pales in comparison to the heart-stopping 35.80% annualized volatility that a buy-and-hold strategy would have subjected you to over the same period. Hence, this seasonality strategy could be seen as a smoother sail through choppy waters.
Now, let’s talk about the Sharpe Ratio, which is essentially the financial world’s way of asking, “Was the risk worth the rewards?” With a Sharpe Ratio of 0.47, the strategy outperforms a risk-free asset by about 47% per unit of risk. It may not be sky-high, but it’s a positive number that suggests that the additional risks taken have provided a reasonable level of additional return.
One of the more sobering statistics we need to consider is the Maximum Drawdown, which tells us the largest loss incurred from peak to trough before a new peak is achieved. With a Max Drawdown of -27.46%, it’s a reminder that even the most well-thought-out strategies can face significant downturns. However, it’s comforting to note that the buy-and-hold approach would have seen investors weathering a much more severe Max Drawdown of -75.59%.
The average drawdown, at -4.82%, coupled with the average drawdown duration of 106 days, provides additional context. These figures suggest that while losses are part of the journey, they have been relatively moderate and short-lived, which is crucial for maintaining the confidence and resolve to stick with a strategy over the long term.
Still, these periods of losses are not to be taken lightly. The Max Drawdown Duration—the longest time it took to recover from a loss—stood at 1236 days. This number is a stark reminder that patience and a long-term perspective are vital when engaging with the stock market.
Risk management is as much about the recovery as it is about the fall. It’s about having a strategy that allows you to ride out the storms and emerge on the other side, ready to capture the market’s next move. While the seasonality trading strategy for Weyerhaeuser Company has had its share of downturns, the overall resilience reflected in these risk management metrics can provide a sense of assurance to the cautious investor.
Trade Analysis
Navigating the intricacies of the stock market requires more than just intuition; it demands a robust strategy backed by empirical data. For those considering a tactical approach to investing in Weyerhaeuser Company, a detailed examination of the backtesting results of a monthly seasonality trading strategy offers illuminating insights.
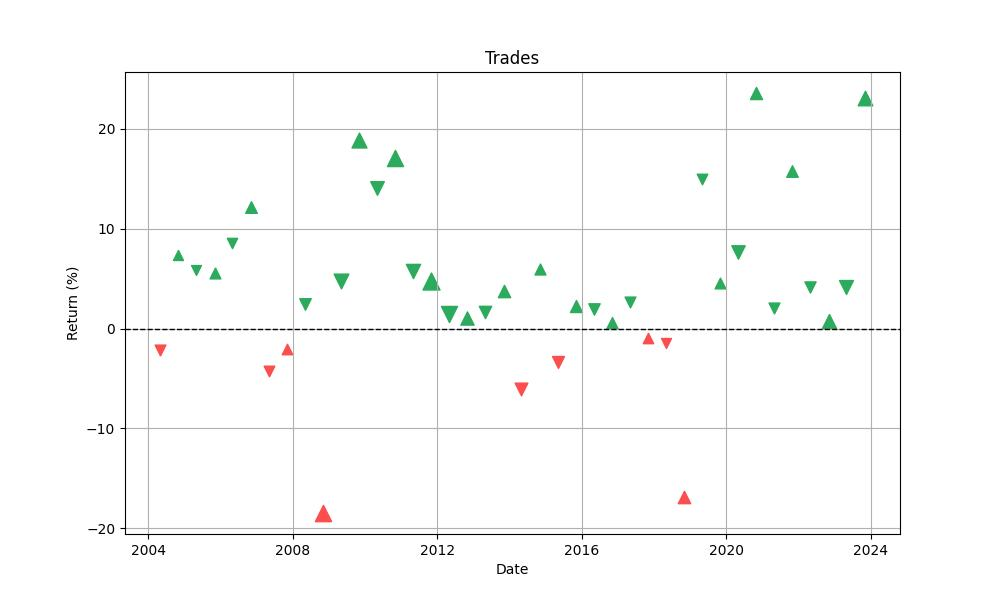
Over the span of 40 trades, the strategy achieved an impressive win rate of 77.5%. This figure stands as a testament to the strategy’s robustness—investors who followed the prescribed trading rules could expect a favorable outcome in over three-quarters of the positions entered. Such a high percentage of successful trades is a beacon of consistency, which is a highly valued attribute in the realm of investing.
The most successful trade, according to the data, saw an exceptional gain of 23.57%. This peak performance illustrates the potential of the strategy to capitalize on favorable market conditions during the specified months. On the flip side, not every trade can be a winner, and the strategy did experience a loss at its worst, which was limited to -18.47%. While losses are an inevitable part of trading, the strategy’s design helps to contain them within manageable limits, preventing catastrophic declines in capital.
The average trade yielded a gain of 3.98%, which offers a more realistic expectation for investors considering the strategy. This average gain, compounded over time, can significantly impact the growth of an investment portfolio. Furthermore, the maximum duration for any single trade was 63 days, with an average trade duration of 46 days. These durations reflect a medium-term investment horizon, which could be suitable for investors who prefer to see returns within a relatively short time frame without the rapid turnover of day trading.
One of the most striking figures in the analysis is the Profit Factor, which stands at 4.13. This metric, which is calculated by dividing the total gains by the total losses from the trades, suggests that the gains from the strategy are over four times the size of the losses. Such a ratio is indicative of a strategy that not only wins often but also wins big when it does.
The Expectancy of 4.34% further complements the Profit Factor. This figure represents the average amount an investor can expect to win or lose on every trade placed. In practical terms, for every dollar risked, the strategy has historically returned an average of 4.34 cents in profit. This is a crucial metric for investors to consider, as it provides a glimpse into the potential profitability of the strategy per trade.
In essence, the backtest results of this monthly seasonality trading strategy for Weyerhaeuser Company paint a picture of a trading approach that is not only profitable but also demonstrates a high degree of reliability and controlled risk. As with any strategy, past performance is not a guarantee of future results, but the data presented here offers a compelling case for the strategy’s effectiveness over the period analyzed.
Conclusion
In conclusion, the seasonal trading strategy applied to Weyerhaeuser Company over the past two decades demonstrates an impressive ability to outperform a passive buy-and-hold approach, both in terms of profitability and risk management. With a final equity significantly higher than that of the buy-and-hold benchmark, an enviable win rate, and controlled drawdowns, this strategy offers a compelling case for investors interested in seasonal market trends.
While the Sharpe Ratio indicates that there is room for improvement in terms of risk-adjusted returns, it remains a more favorable option compared to the more volatile buy-and-hold strategy. The strategy’s resilience is further underscored by its modest maximum drawdown and shorter drawdown durations, suggesting that it is designed to weather the market’s fluctuations more smoothly.
The trade analysis shines a light on the strategy’s consistency and risk containment, with a high win rate, reasonable average gains, and a profit factor that suggests a strong ability to maximize returns while minimizing losses. This disciplined approach to trading, based on historical monthly patterns, has not only shown to be effective in backtesting but also serves as a blueprint for investors seeking to optimize their trading strategies in accordance with seasonal market behaviors.
As investors reflect on these findings, it is crucial to remember that past performance is not indicative of future results. However, the detailed analysis of this seasonal trading strategy provides a robust framework for understanding and potentially capitalizing on the cyclical nature of the stock market. By maintaining a disciplined approach and being mindful of risk, investors can utilize these insights to navigate the seasonality of the markets with greater confidence and precision.

“Make the invisible visible. My goal is to shine a light on the subtle seasonal signals in the stock market, providing investors with the insight needed to make informed decisions. By breaking down the complexities of seasonality, I strive to empower our audience with knowledge and foresight, turning data into action.”