Introduction
As the leaves change colors and the air grows crisp, the adage “sell in May and go away” echoes through the corridors of Wall Street, hinting at the ancient wisdom of seasonality in stock markets. But in a world where every investor is armed with charts and data, is there still a secret melody that can lead us to a bountiful harvest in the financial orchards? Welcome to our exploration of the seasonal trading strategies that could help you tap into the rhythmic pulse of the stock market, specifically focusing on the Performance Food Group Company (PFGC).
With the precision of a maestro, we will orchestrate an understanding of how the calendar months can influence stock performance and guide you through a strategy that aims to capitalize on these temporal shifts. We’ll unpack how historical patterns can light the path for future investments and why certain months might be the key to unlocking the treasure chest of market returns. This is not just about data; it’s about the story behind the numbers, a tale of time and tide in the financial markets that could potentially lead to profit for the astute investor.
Join us as we dissect the backtest results of a monthly seasonality trading strategy on PFGC’s stock, a journey that promises to be both enlightening and profitable. We will demystify complex seasonal trends and translate them into actionable insights, ensuring that you’re not just following the market’s tempo but anticipating its next move with confidence. So, prepare to embark on a voyage through time and trade, where the calendar is your compass and historical patterns your map to potential riches.
Company Overview
Performance Food Group (PFGC) is a foodservice distribution titan in North America, catering to a vast spectrum of customers across the industry. Founded in 1996, PFGC has etched its name as a leading broadline distributor, delivering an extensive range of more than 250,000 food and non-food products to a diverse clientele spanning restaurants, healthcare facilities, schools, and more. The company’s prowess lies in its expansive network of distribution centers strategically scattered across the nation, enabling it to serve its customers with unparalleled efficiency and speed. PFGC’s commitment to innovation and operational excellence translates into substantial value for its clients, who reap the benefits of custom-tailored solutions, cost-saving measures, and unwavering support. To maintain its competitive edge, PFGC relentlessly pursues strategic acquisitions, continuously strengthening its market position and augmenting its offerings to stay ahead of the curve in the ever-evolving foodservice landscape.
Strategy Overview
In the intricate dance of the markets, timing often leads the waltz of profits and losses. For investors in Performance Food Group Company (PFGC), understanding the rhythm of seasonality could unlock opportunities that many might overlook. Today, we delve into the backtest results of a monthly seasonality trading strategy, designed to capitalize on historical patterns observed in PFGC’s stock performance.
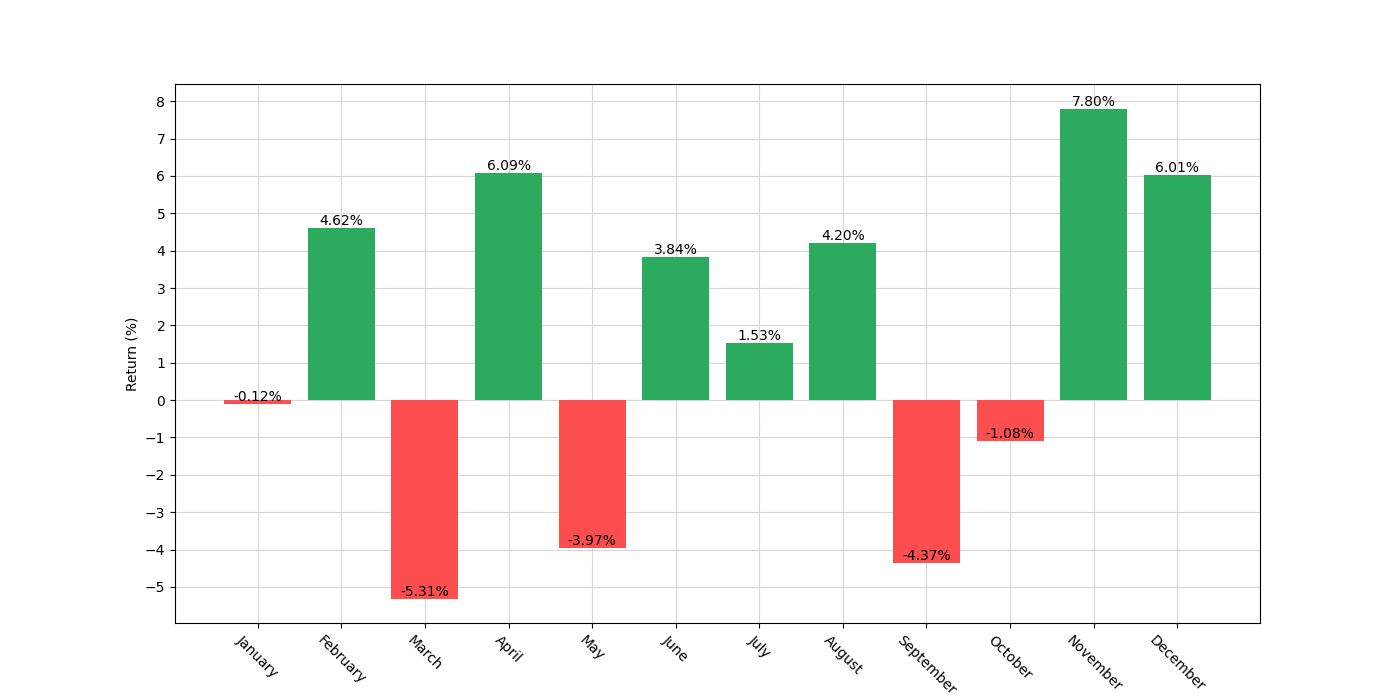
This strategy is grounded in the concept that certain months bring forth predictable movements in PFGC’s stock price, allowing investors to position themselves strategically to benefit from these seasonal trends. Specifically, the strategy dictates entering long positions—betting on the stock to increase in value—during the months of April, June, November, and December. Conversely, it suggests going short—anticipating a decline in stock price—for the months of May and September. It’s a bold approach, one that dances between optimism and caution with the precision of a seasoned trader.
The backtest, which spans from October 1, 2015, to December 29, 2023, a period of 3011 days, offers a glimpse into the potential efficacy of this time-centric strategy. Within this timeframe, the strategy was active for approximately 51.3% of the time, indicating a balanced exposure that mitigates the risk of being overly invested during unfavorable market conditions.
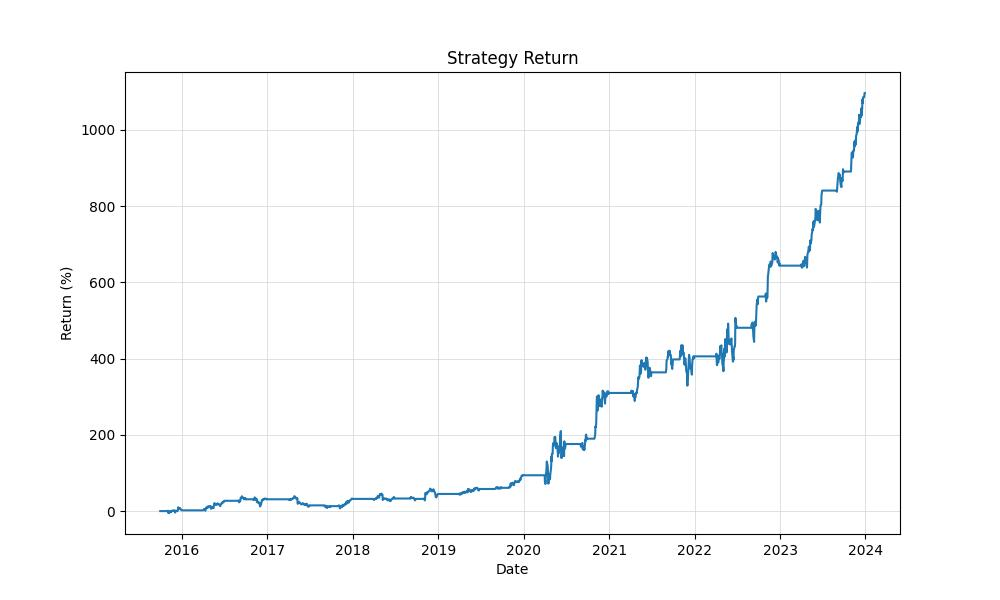
Starting with an initial capital of $10,000, the strategy’s performance is notable. It culminated in an impressive equity final balance of $119,690.26, reaching the same peak. This result represents a staggering return of 1096.9%, a figure that casts a long shadow over the buy & hold return of 260.16%. When annualized, the strategy’s return stands at 35.16%, a testament to its potential to amplify gains within the selected seasonal windows.
Such numbers are eye-catching, but they don’t come without their own set of risks and considerations. However, what these results suggest is that for the period in question, the seasonality strategy not only outperformed a simple buy & hold approach but did so with a rhythm that could have investors tapping their feet all the way to the bank. This backtest offers a melody of market movement that, if listened to closely, could be the siren song for savvy investors looking to harness the seasonal ebbs and flows of the Performance Food Group Company’s stock.
Key Performance Indicators
Investing in the stock market requires a nuanced understanding of the many factors that can influence performance. One such approach that has garnered attention among savvy investors is the implementation of a monthly seasonality trading strategy. By harnessing the cyclical patterns that emerge within certain months, this approach seeks to capitalize on the predictable shifts in market sentiment and price movement.
In the case of Performance Food Group Company (PFGC), an intriguing pattern has emerged from a detailed analysis of historical data. The strategy, which was backtested over a span from October 1, 2015, to December 29, 2023, covering 3011 days, involved taking long positions in April, June, November, and December, while short positions were entered in May and September. What sets this strategy apart is the selective engagement with the market—trades were only active approximately 51.3% of the time, allowing for a reduced exposure to market volatility during historically less favorable periods.
The results of this strategy have been nothing short of impressive. With an initial capital investment of $10,000, the strategy has seen an equity final balance swell to $119,690.26, which also represents the peak equity level attained during the backtesting period. When we translate this to percentage terms, this strategy has delivered a staggering return of 1096.9%. This is particularly noteworthy when compared to the ‘buy and hold’ return of 260.15% over the same period, underscoring the effectiveness of the seasonal approach.
Diving deeper into the annualized figures further highlights the strategy’s robust performance. The annualized return stands at an impressive 35.16%, a figure that many investors would find enviable in the context of traditional stock market investments. This outperformance is indicative of the strategy’s ability to leverage seasonal trends effectively, translating into substantial portfolio growth over time.
While the raw returns are certainly attractive, they must be considered in the context of the risks undertaken to achieve them. The annualized volatility of the strategy was measured at 39.39%, which, while significant, must be weighed against the returns it has facilitated. The risk-adjusted performance, as measured by the Sharpe Ratio, is 0.8927, indicating that the excess return of the strategy over the risk-free rate is favorable when adjusted for the volatility experienced.
What this analysis makes clear is that the seasonal trading strategy applied to Performance Food Group Company has not only produced returns that far outstrip the benchmark ‘buy and hold’ approach but has done so with a risk profile that may be acceptable to many investors seeking to maximize their return potential while navigating the inherent uncertainties of the stock market. This strategy, with its impressive returns and risk-adjusted performance, could be a compelling addition to the arsenal of tools employed by investors looking to optimize their portfolio strategies based on seasonal market trends.
Risk Management
In the intricate ballet of investing, risk is the ever-present partner to reward, and understanding this relationship is essential for any trading strategy. When it comes to the monthly seasonality trading strategy applied to Performance Food Group Company, the dance with risk is choreographed with precision.
The annual volatility, which measures the degree of variation in trading prices over time, stands at 39.39% for the strategy. This figure indicates a moderate level of risk, as higher volatility often correlates with the potential for larger swings in equity value. However, the Sharpe Ratio, a metric used to understand the return of an investment compared to its risk, is 0.89 for this strategy. While a Sharpe Ratio above 1 is typically seen as better, given that the strategy’s ratio is close to this threshold, it suggests that the returns are reasonably good relative to the risk taken.
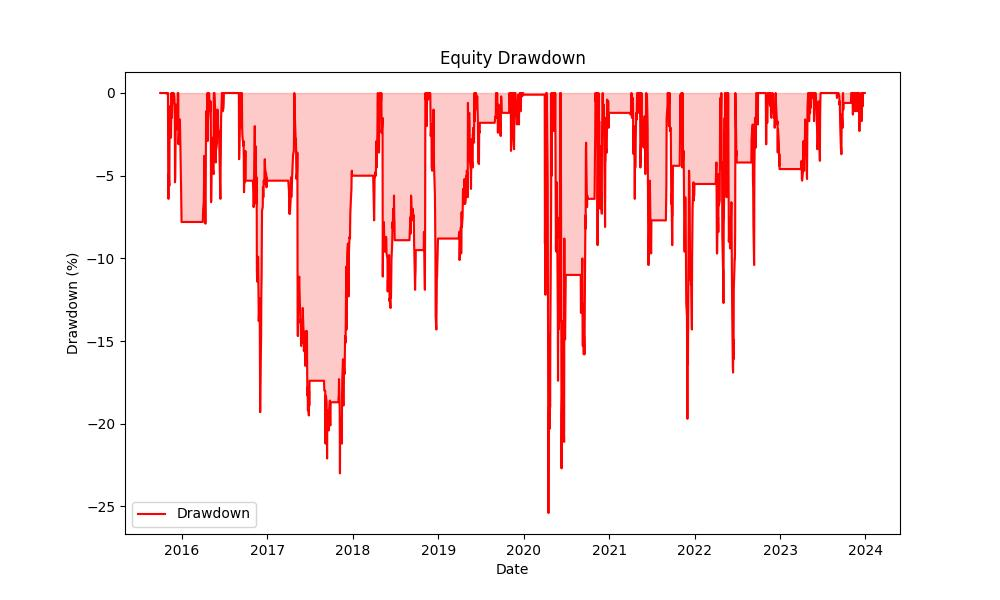
Risk management is further quantified by examining drawdowns, which are the peak-to-trough declines in the account’s equity value. The maximum drawdown experienced by the strategy is -25.36%, a significant number, but when placed in the context of the overall return, it paints a picture of a risk that was well-contained. The average drawdown is much lower at -4.96%, indicating that while the strategy may have periods of decline, they are generally not severe.
Moreover, the duration of these drawdowns is also a vital aspect of risk assessment. The maximum drawdown duration — the longest time the strategy has experienced a drawdown before recovering — is 357 days. In contrast, the average drawdown duration is a mere 34 days. This relatively quick recovery from drawdown periods demonstrates the strategy’s resilience and adds a layer of comfort for investors concerned about prolonged periods of underperformance.
When interpreting these risk parameters, it’s evident that the trading strategy in question has been tailored to not only capitalize on potential gains during selected months but also to mitigate and manage risk effectively. Such a strategy may appeal to the cautious investor who seeks to balance potential returns with a measured approach to risk, ensuring that their investment journey is both prudent and potentially profitable.
Trade Analysis
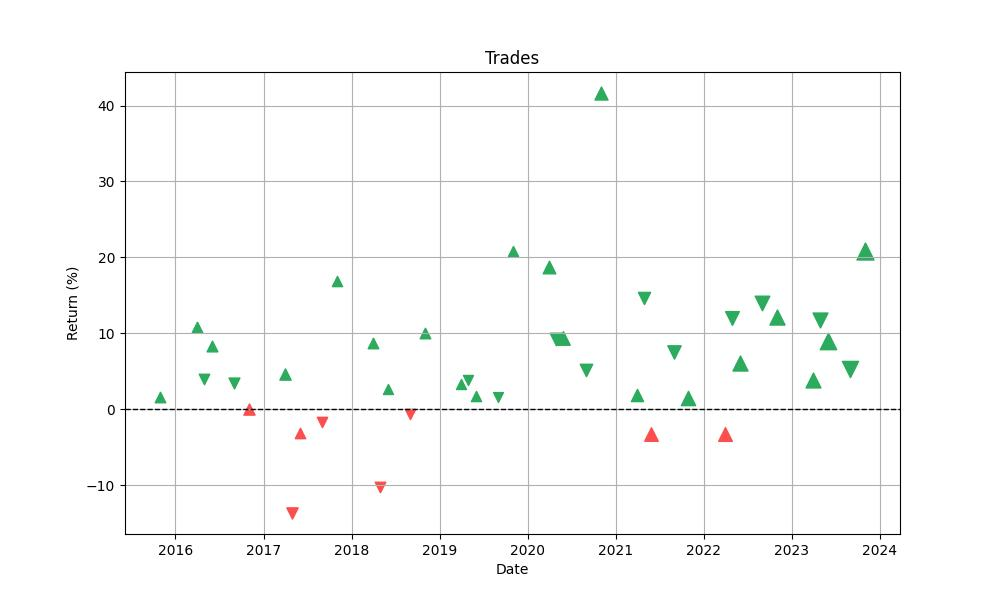
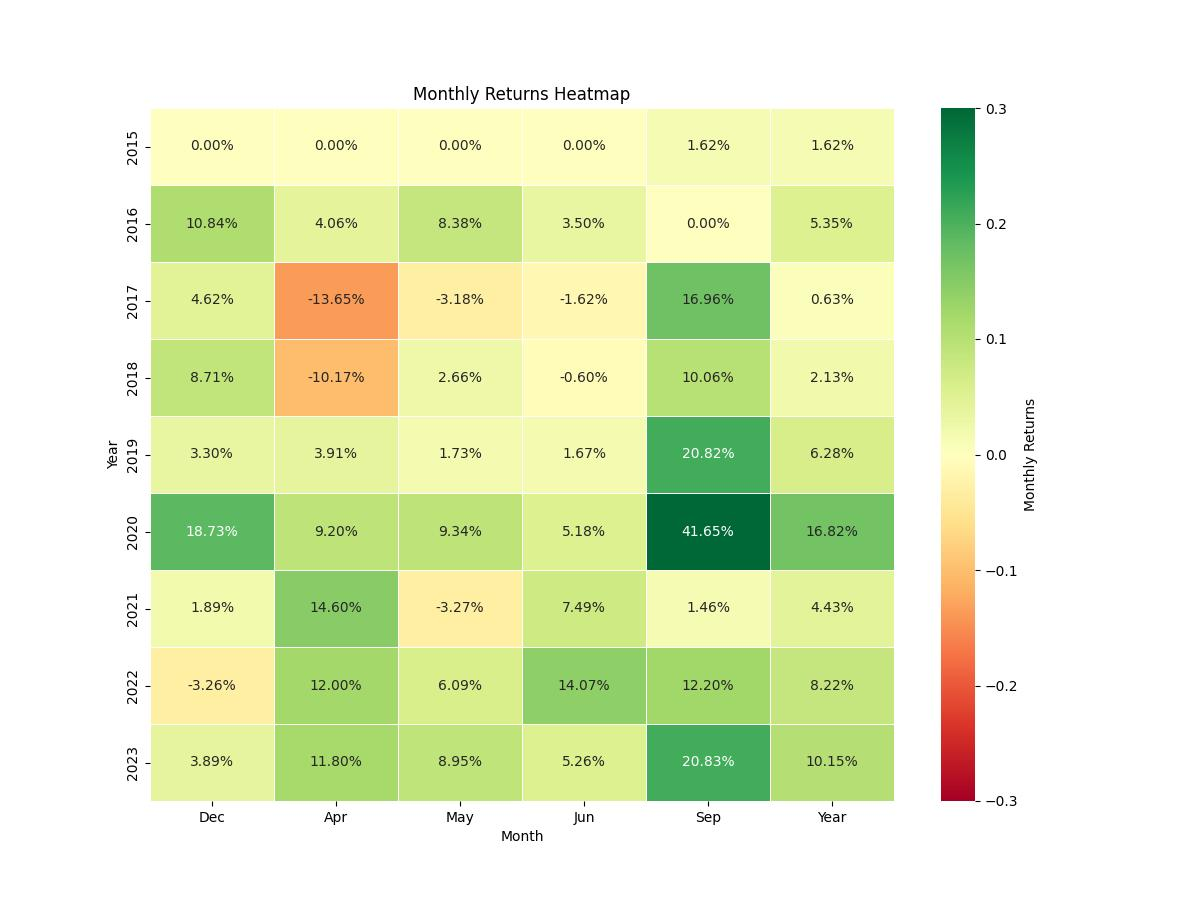
When exploring the intricacies of the seasonal trading strategy applied to Performance Food Group Company (PFGC), the backtesting results reveal a tapestry of insights that are crucial for a retail investor’s understanding. The strategy, which is predicated on timing the market by initiating long or short positions in specific months, has been tested over a period that witnessed 41 trades. The meticulous selection of months for going long (April, June, November, and December) and short (May and September) has led to an impressive win rate of approximately 80.49%. This high win rate suggests a strong alignment of the strategy with PFGC’s historical performance patterns.
Delving deeper into the results, the best trade recorded an exceptional gain of 41.65%, a figure that underscores the potential of well-timed entries in sync with seasonal trends. On the flip side, even the most carefully crafted strategies encounter setbacks, as evidenced by the worst trade, which resulted in a loss of 13.65%. Nonetheless, the average trade yielded a positive return of 6.25%, reinforcing the strategy’s effectiveness over the test period.
Duration also plays a pivotal role in the analysis, with the longest trade unfolding over a 63-day period and the average trade lasting 37 days. This indicates a relatively short holding period for each trade, aligning with the short-term seasonal approach of the strategy.
Furthermore, the Profit Factor, sitting at a robust 8.60, offers a compelling narrative of the strategy’s profitability. This metric, which is the ratio of gross profits to gross losses, points to an outcome where the gains significantly outweigh the losses, a testament to the strategy’s efficacy.
Expectancy further augments the narrative by quantifying the average return one can anticipate from each trade. With an expectancy of 6.63%, investors can gauge the potential profitability of each trade within the strategy, providing a clear financial expectation for future trades based on past performance.
Lastly, the System Quality Number (SQN), which measures the strategy’s reliability and robustness, stands at 3.98. This is indicative of a high-quality system, with a score above 3 generally considered good and above 5 excellent. This SQN value, alongside the aforementioned metrics, paints a portrait of a strategy that has not only been successful in historical terms but also possesses attributes that suggest a well-considered approach to seasonal stock market trading for PFGC.
Conclusion
In conclusion, the journey through the seasonality of Performance Food Group Company’s stock market performance has been enlightening. We have observed that a well-crafted monthly seasonality trading strategy, which is sensitive to the ebb and flow of historical stock patterns, can lead to remarkable returns that significantly outpace a traditional buy & hold strategy. With a staggering return of 1096.9% over the backtesting period and an annualized return of 35.16%, this strategy has demonstrated its potential to enhance investor portfolios.
However, these returns are not without their risks, and the strategy has been designed with a mindful approach to risk management. An annual volatility of 39.39% and a maximum drawdown of -25.36% were part of the investment landscape, balanced by a respectable Sharpe Ratio of 0.89 and swift recovery from drawdown periods. The high win rate of 80.49% across 41 trades, coupled with a Profit Factor of 8.60 and an expectancy of 6.63%, underscores the strategy’s effectiveness.
The analysis of trade duration, the best and worst trades, and the overall quality of the system as indicated by the SQN, reinforces the robustness of this seasonal trading approach. For investors considering a strategy that marries seasonal market awareness with disciplined risk management, the insights gleaned from PFGC’s backtesting results may offer a compelling narrative.
As we close the book on this exploration of temporal market trends, it is clear that the seasonality trading strategy for PFGC warrants consideration for those looking to diversify their trading approaches. While past performance is not indicative of future results, the data presented offers a persuasive case for the potential benefits of incorporating seasonality into investment decision-making. As with all investments, individuals should consult with financial advisors, consider their risk tolerance, and perform their own due diligence before embarking on any trading strategy.

“Make the invisible visible. My goal is to shine a light on the subtle seasonal signals in the stock market, providing investors with the insight needed to make informed decisions. By breaking down the complexities of seasonality, I strive to empower our audience with knowledge and foresight, turning data into action.”

