Introduction
As the leaves change with the seasons, so too does the landscape of the stock market. Like a skilled farmer who knows precisely when to sow and when to reap, an astute investor understands that timing can be everything. The concept of seasonality in stock trading taps into the rhythmic patterns of the market, offering the potential to harvest gains by capitalizing on these recurring temporal trends.
In this blog post, we’re going to unravel the complexities of market seasonality and its impact on trading strategies, with a particular focus on The Liberty SiriusXM Group. Seasonality strategies, such as the one we will discuss, are based on historical patterns that suggest certain times of the year are statistically more favorable for specific stock movements. These strategies are not just about identifying the right moments to trade but also about understanding and managing the inherent risks.
Whether you’re a seasoned trader or a curious newcomer, our exploration of seasonality strategies will provide you with insights into how these temporal market patterns might be leveraged to potentially enhance your investment portfolio. But remember, the markets are as unpredictable as the weather, and past performance is not a guarantee of future results. As we delve into the seasonality of The Liberty SiriusXM Group and its intriguing trading strategy, keep in mind that the value of such strategies lies as much in their disciplined approach as in their historical performance. Join us as we dissect the mechanics, the risks, and the potential rewards of trading with the seasons.
Company Overview
The Liberty SiriusXM Group (LSXMA), a prominent media and entertainment conglomerate, stands tall as the leading audio entertainment company in North America and beyond. Its core offerings encompass satellite radio services, music streaming platforms, podcasts, and related digital content. LSXMA primarily caters to a vast and diverse audience, spanning music enthusiasts, podcast listeners, and those seeking a personalized and immersive audio experience. The company’s revenue streams stem from subscription fees, advertising sales, and content licensing agreements. LSXMA’s value proposition lies in its extensive content library, user-friendly platforms, and commitment to innovation, enabling it to deliver a captivating and engaging audio experience to its subscribers. Operating on a hybrid model, the company combines traditional satellite radio broadcasting with cutting-edge streaming technologies, ensuring a seamless and accessible service for its customers. Growth strategies revolve around expanding its subscriber base, diversifying content offerings, and enhancing technological capabilities to stay ahead in the rapidly evolving digital audio landscape. The industry landscape presents both opportunities and challenges, with LSXMA poised to capitalize on the growing demand for personalized audio entertainment while navigating competitive pressures and regulatory changes.
Strategy Overview
In the pursuit of market-beating returns, investors often explore various trading strategies, with seasonality being a fascinating lens through which to scrutinize market patterns. Let’s dive into the specific monthly seasonality trading strategy applied to The Liberty SiriusXM Group (Symbol: LSXMA).
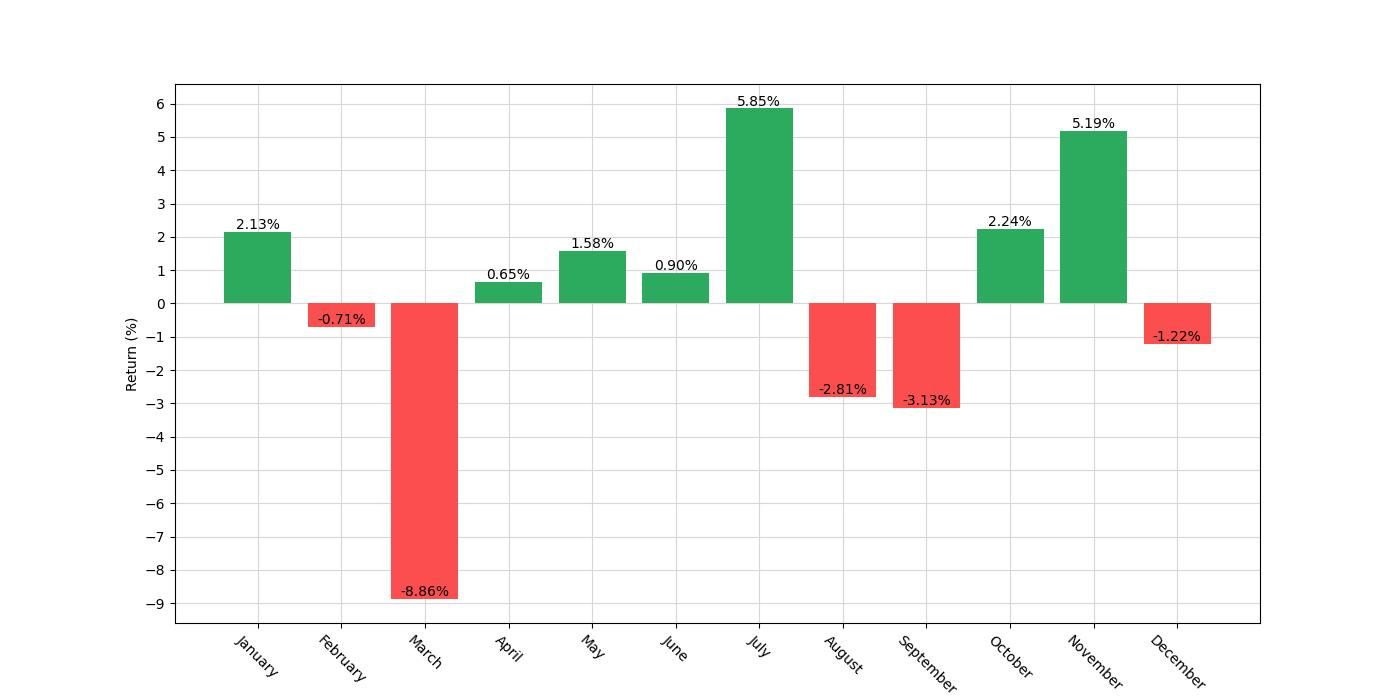
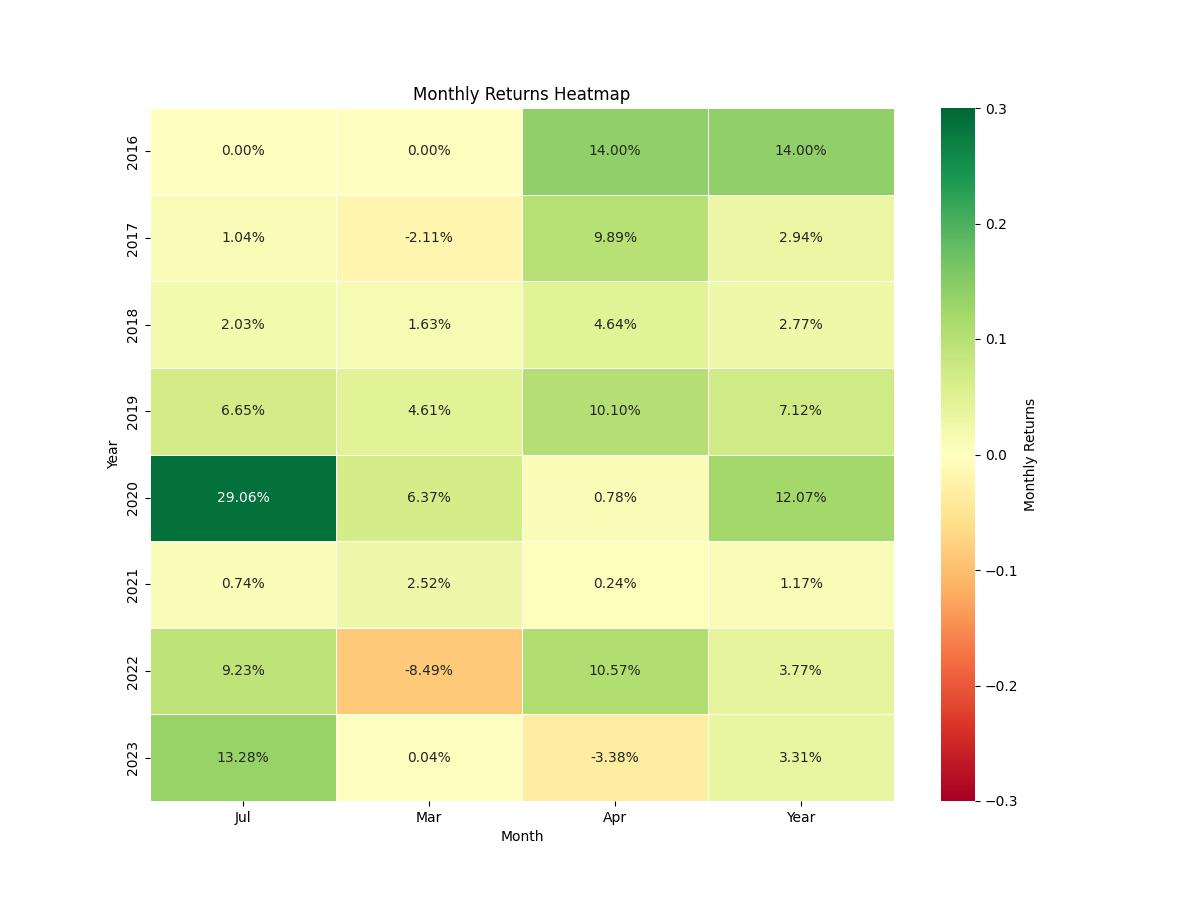
This strategy operates on a simple premise: it rides the seasonal tailwinds by establishing a long position during months historically known for positive performance, and conversely, it takes a short position during a month that is typically bearish. According to the backtest results, the chosen months to go long are April and July. In contrast, the strategy advocates for a short position in March.
The dataset for this seasonality strategy spans from April 18, 2016, until December 29, 2023, covering a substantial period of 2811 days. Throughout this duration, it’s notable that the exposure time—the period when the strategy was actively engaged in the market—was 24.69%. This relatively low exposure time suggests a focused approach, engaging with the market only during specific periods of anticipated seasonal strength or weakness.
The initial capital allocated to this strategy was $10,000, which, through the course of the backtesting period, evolved significantly. Notably, this strategy does not factor in commissions or slippage, which, in real-world trading, could have a considerable impact on the actual returns and should be taken into account when considering the efficacy and net profitability of the strategy.
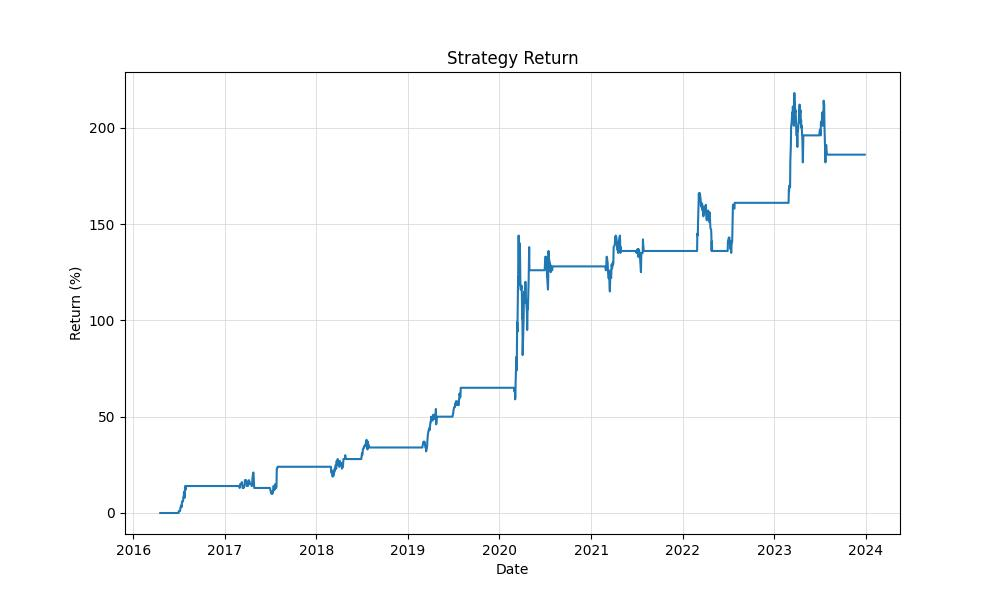
What stands out from the backtesting results is the stark contrast between the returns of the seasonal strategy and the buy-and-hold approach over the same period. While the buy-and-hold approach would have resulted in a slightly negative return of -6.32%, the seasonal strategy boasts an impressive return of 185.93%. Even more compelling is the annualized return of the strategy, which sits at 14.62%, a robust figure that would catch any investor’s eye, especially when compared to the annualized buy-and-hold return that languishes in negative territory.
Investors often seek strategies that can outperform simple buy-and-hold strategies, and the seasonal approach applied to The Liberty SiriusXM Group appears to be a strong contender, at least within the confines of this backtest’s historical data. However, it is crucial for investors to remember that past performance is not indicative of future results, and seasonality is but one factor in the complex equation that is the stock market. Engaging with this strategy would require an investor’s confidence in the perpetuation of historical seasonal trends into the future.
As we navigate through the intricate dance of numbers, it’s evident that this strategy’s allure lies not only in its historical performance but also in its methodical engagement with the market, predicated on the belief that certain times of the year are more opportune for trading specific stocks.
Key Performance Indicators
When examining the efficacy of a trading strategy, it’s crucial to delve into the core metrics that signal performance. Our analysis of The Liberty SiriusXM Group’s monthly seasonality strategy showcases some compelling statistics worth noting for investors.
Starting with the endgame figures, the strategy’s final equity amount stands at a robust $28,593.21, a significant climb from the initial capital of $10,000. This growth is not just a number—it represents an impressive total return of 185.93%. To put this in perspective, had the same initial investment been left to the whims of the market in a buy-and-hold scenario, the returns would actually have been negative, at -6.32%. This stark contrast highlights the potential advantage of a well-orchestrated seasonal strategy over a passive market approach.
Diving deeper, the annualized return, which smooths out the performance over each year, provides a rate of 14.62%. This robust figure outshines the annualized return of the buy-and-hold approach, which disappointingly sits at -1.40%. The annualized metric is particularly useful for investors as it paints a more consistent picture of what one could expect year over year, rather than the absolute total return which can be influenced by particularly strong or weak periods.
Now, let’s pivot to the peak equity—the highest value the portfolio reached during the strategy’s lifespan—which touched $31,807.35. This peak is a beacon of the strategy’s potential, even though investors should note that such highs are seldom maintained due to market volatility.
Speaking of which, volatility is a measure of the risk or uncertainty regarding the size of changes in a security’s value. In this strategy, the annualized volatility stands at 18.91%. This is a crucial figure as it suggests the ride wasn’t a smooth one, despite the attractive returns. The strategy’s volatility is lower compared to the 32.99% annualized volatility seen in the buy-and-hold scenario, highlighting the strategic approach’s relative steadiness.
Now, let’s touch on the Sharpe Ratio, which stands at 0.77. This ratio helps investors understand the return of an investment compared to its risk. The higher the Sharpe Ratio, the better the risk-adjusted performance. While a Sharpe Ratio of 1 or above is often considered excellent, the strategy’s ratio suggests that the returns were fairly good in relation to the volatility endured by the investor.
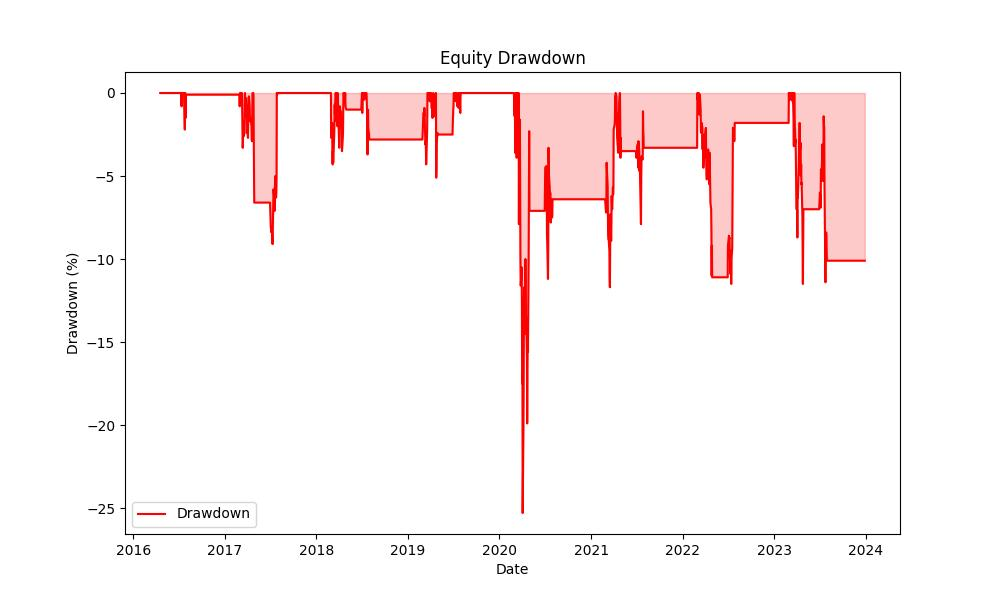
Lastly, we delve into drawdowns, which are the declines from a strategy’s peak to its trough before a new peak is achieved. The maximum drawdown was -25.32%, indicating the largest single drop in value the strategy experienced. While a quarter of the value at its worst point might seem daunting, it is relatively modest when we compare it to the -60.36% seen in the buy-and-hold approach. Furthermore, the average drawdown was just -3.07%, and the average drawdown duration was 56 days, suggesting that while the strategy had its dips, they were generally short-lived and less severe.
These key metrics provide a comprehensive view of the strategy’s performance, offering a glimpse into the potential benefits of incorporating seasonal trading strategies into an investor’s toolkit. It’s a testament to the idea that strategic, time-based maneuvers in the stock market can indeed yield significant returns while managing risk.
Risk Management
In dissecting the anatomy of our seasonal trading strategy’s performance, we must cast a spotlight on how it navigates the tempestuous seas of market risk—a crucial consideration for any prudent investor.
Risk, in the context of stock trading, is a multifaceted beast, but one of the most telling indicators of a strategy’s risk profile is its annual volatility. For The Liberty SiriusXM Group, our strategy exhibited an annualized volatility of 18.91%. To put this in perspective, this figure essentially measures the degree to which the strategy’s returns deviated from its average over the course of a year. While volatility is inherent in the stock market, a value under 20% suggests a moderate level of risk, especially when juxtaposed with the buy and hold strategy’s much higher annual volatility of 32.99%.
The Sharpe Ratio, another beacon of risk assessment, shines at 0.773 for our strategy. This metric champions the notion of risk-adjusted returns, answering the vital question: “Are the returns worth the risk taken?” A Sharpe Ratio greater than 1 is considered excellent, between 0.5 to 1 is good, and less than 0.5 is suboptimal. At 0.773, our strategy sits comfortably in the ‘good’ territory, reassuring investors that the excess return is quite favorable relative to the additional risk.
Now, let’s navigate the choppy waters of drawdowns. The Max. Drawdown, which hit a 25.32% trough, might seem daunting at first. It measures the largest peak-to-trough drop in the strategy’s value, giving us a glimpse into the worst-case scenario an investor might have endured. However, when we compare this to the staggering 60.36% drawdown faced by a static buy and hold approach, our strategy stands as a lighthouse, guiding investors away from the risk of larger losses.
But the ocean’s depth isn’t our only concern; the time spent underwater matters too. The Max. Drawdown Duration for our strategy was 404 days, a period that requires resilience from investors. The Avg. Drawdown Duration, however, presents a less intimidating figure of 56 days. These temporal measures of drawdowns tell us how long it took for the strategy to recover from its losses, a vital consideration for those charting their financial course over a shorter horizon.
By sailing through these risk metrics, we can conclude that our seasonal trading strategy for The Liberty SiriusXM Group has not only managed to stay afloat but also navigate through market volatility with a calculated grace. It’s a strategy that has shown to temper the risks while seeking to maximize the winds of favorable returns, a balance that is critical for retail investors in the ever-shifting tides of the stock market.
Trade Analysis
When it comes to understanding the effectiveness of a trading strategy, the devil is often in the details. A careful examination of trade-specific data can reveal much about the potential risks and rewards of following a particular approach. In the case of The Liberty SiriusXM Group’s monthly seasonality trading strategy, we’ve uncovered some fascinating insights that could be of great interest to retail investors who are considering this method.
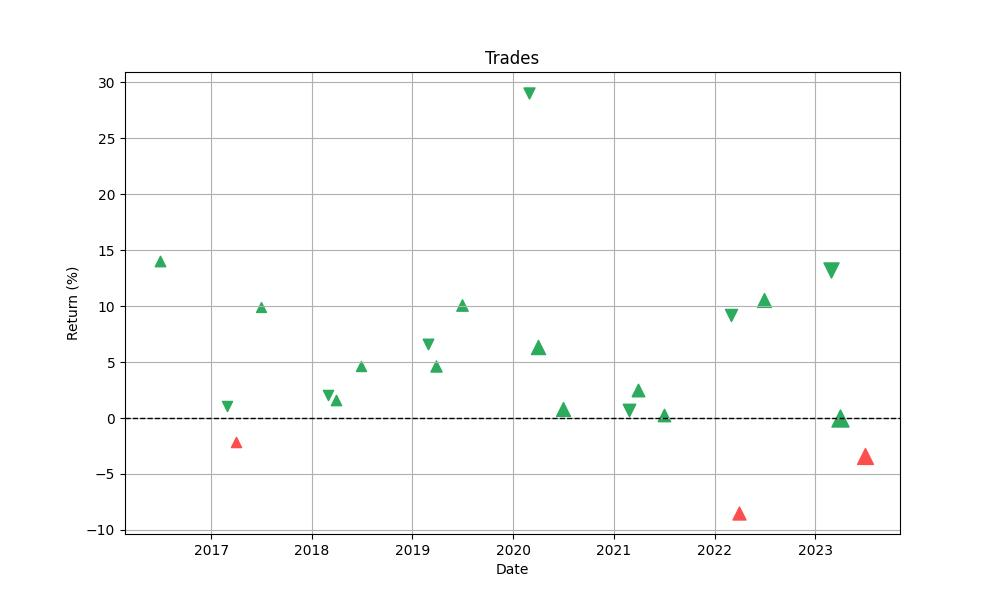
Over the course of the backtesting period, a total of 22 trades were executed. This relatively low number is indicative of a strategy that is selective, operating only during specific months which have historically shown a higher probability of significant price movements for LSXMA. Of these trades, an impressive 86.36% were successful, suggesting a high level of accuracy in predicting monthly trends for this stock. This win rate far exceeds what one might expect from random chance, highlighting the potential efficacy of the strategy.
The best trade yielded a remarkable 29.06% return, showcasing the strategy’s ability to capitalize on strong positive market moves. Conversely, the worst trade resulted in an 8.49% loss, which, while not insignificant, is modest compared to the gains of the best trades. It’s a clear reminder that even with a high win rate, not every trade will be a winner, and losses are part of the trading process.
On average, each trade generated a 4.90% return, which is a robust figure, especially when considering the strategy’s exposure time in the market. With an average trade duration of 31 days, this strategy does not require a long-term commitment to a position, which can be advantageous for those seeking to avoid the risks associated with prolonged market exposure.
The profit factor, sitting at a striking 9.12, further underscores the profitability of the strategy. This metric, which is calculated by dividing the total gains of the winning trades by the total losses of the losing trades, indicates that the winning trades are, on average, generating significantly more profit than what is being lost on the losing trades.
The expectancy of 5.16% is another metric pointing toward the potential success of the strategy. It measures the expected return per trade, on average, taking into account both winning and losing trades. A positive expectancy is a good sign, as it implies that over the long run, the strategy is likely to be profitable.
Finally, the strategy’s System Quality Number (SQN) score of 2.69 reflects the overall quality and reliability of the system. The SQN is a measure that incorporates frequency and size of trades, as well as their consistency. A score above 2.5 is generally considered good, and it indicates a system that is likely to perform well going forward.
In sum, the trading strategy’s backtest results present an intriguing proposition, with a high win rate and a strong profit factor, bolstered by positive expectancy and SQN. These figures suggest that the monthly seasonality strategy for The Liberty SiriusXM Group is not only capable of capturing substantial returns during its selected trading windows but also shows a consistency that might provide a level of confidence to investors seeking to employ a more tactical, time-sensitive approach to their portfolio.
Conclusion
In conclusion, the exploration of The Liberty SiriusXM Group’s monthly seasonality trading strategy reveals a compelling case for investors considering a tactical approach to the stock market. The strategy’s impressive backtest performance, with a total return of 185.93% and an annualized return of 14.62%, starkly outperforms the passive buy-and-hold strategy over the same period. Key performance indicators, such as the robust final equity amount, lower volatility, and a Sharpe Ratio in the ‘good’ range, suggest that this strategy managed to navigate market risks effectively while delivering noteworthy returns.
Notably, the strategy’s risk management profile indicates a moderate level of risk, with a max drawdown significantly lower than that of a buy-and-hold strategy and a drawdown duration that, on average, is relatively short-lived. This suggests that while there are inherent risks, the strategy is designed to mitigate these to a degree, providing a buffer against the market’s inherent uncertainties.
The trade analysis further bolsters the strategy’s appeal, with a high win rate and a profit factor that signals a methodical and selective approach to trading. The positive expectancy and SQN score reinforce the strategy’s potential for future profitability and reliability, offering a degree of confidence to investors who might consider incorporating such a seasonal trading strategy into their investment arsenal.
Ultimately, while historical data can never guarantee future results, and every trading strategy carries its own set of risks, the monthly seasonality strategy for The Liberty SiriusXM Group presents an intriguing option for investors looking to capitalize on seasonal market trends. It underscores the potential value of a disciplined, time-based approach to the stock market, one that leverages historical patterns to navigate the complex dynamics of equity trading. As with all investment strategies, individuals should consider their risk tolerance, investment goals, and the importance of diversification before implementing such a specialized approach.

“Make the invisible visible. My goal is to shine a light on the subtle seasonal signals in the stock market, providing investors with the insight needed to make informed decisions. By breaking down the complexities of seasonality, I strive to empower our audience with knowledge and foresight, turning data into action.”

