


Introduction
In the intricate tapestry of financial markets, understanding the nuanced patterns that govern stock performance across different times of the year can provide savvy investors with a strategic edge. Seasonality, the observed tendency for the stock market to experience predictable changes in performance during certain periods, forms the foundation of many trading strategies that aim to capitalize on these temporal shifts. Our goal is to demystify the complex seasonal data and offer investors clear, actionable insights that can help them make informed decisions.
Embarking on this journey, we’ll explore the intriguing world of seasonal trading strategies, focusing on a backtested approach involving the iShares Global Infrastructure ETF (IGF). Through meticulous analysis, we will uncover the potential benefits of employing a strategy that selectively engages in the market during historically profitable months, comparing its performance to the traditional buy-and-hold tactic. By dissecting the key performance indicators, risk management measures, and detailed trade analysis, we aim to furnish investors with a comprehensive understanding of how seasonality could influence their investment strategies and possibly enhance their portfolio returns.
Join us as we delve into a realm where timing is not just a concept, but a calculable factor that, when harnessed with precision, can transform the way we approach the ever-changing landscape of the stock market.
Company Overview
iShares Global Infrastructure ETF (NASDAQ: IGF) is a widely-diversified exchange-traded fund that offers investors exposure to a global portfolio of infrastructure companies. The fund seeks to track the performance of the S&P Global Infrastructure Index, which comprises developed market companies that derive at least 50% of their revenues from infrastructure-related activities, including utilities, transportation, water, and telecommunications. IGF provides retail investors with an opportunity to invest in infrastructure assets worldwide, potentially benefiting from the long-term growth prospects of critical infrastructure sectors. The fund’s core product is its diversified portfolio of infrastructure companies, providing exposure to various industries and geographies.
Strategy Overview
Investors often seek strategies that can outperform the market, and examining seasonality patterns can be a captivating approach to navigating the ebbs and flows of the stock market. A compelling illustration of this concept can be found in the backtest results of a seasonal trading strategy applied to the iShares Global Infrastructure ETF (IGF).
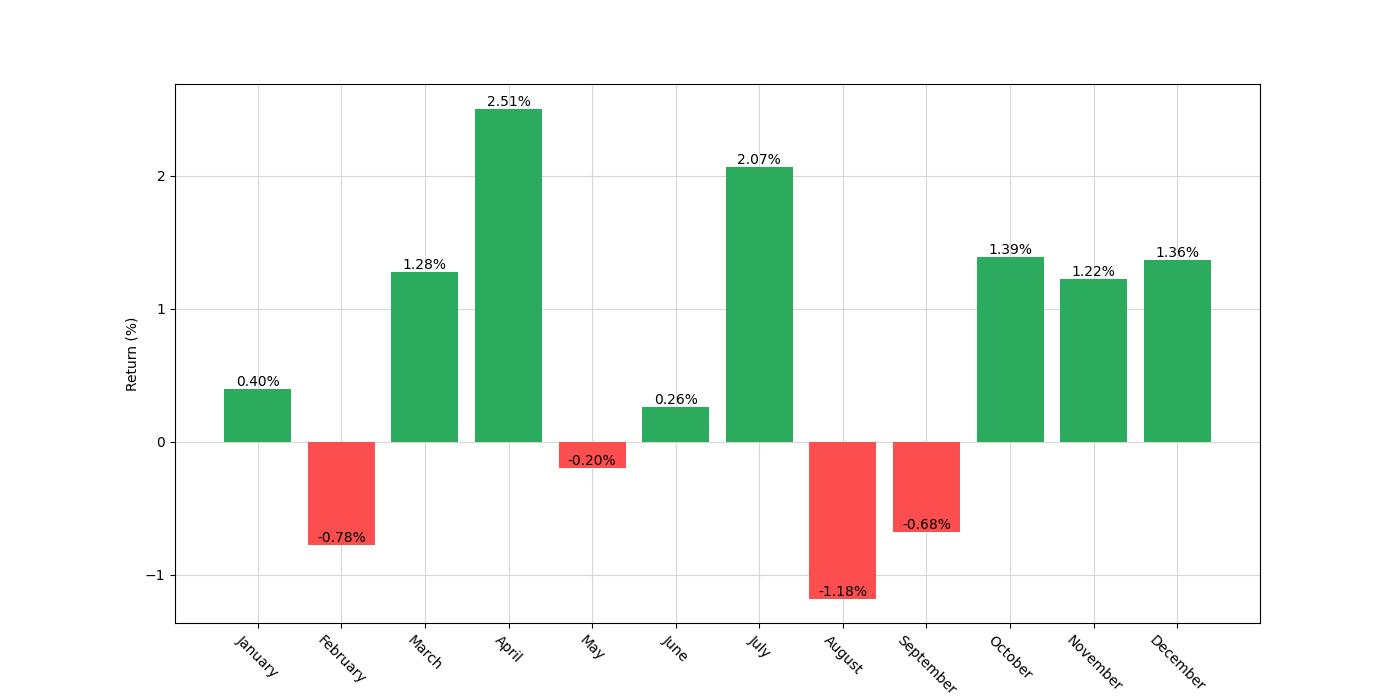
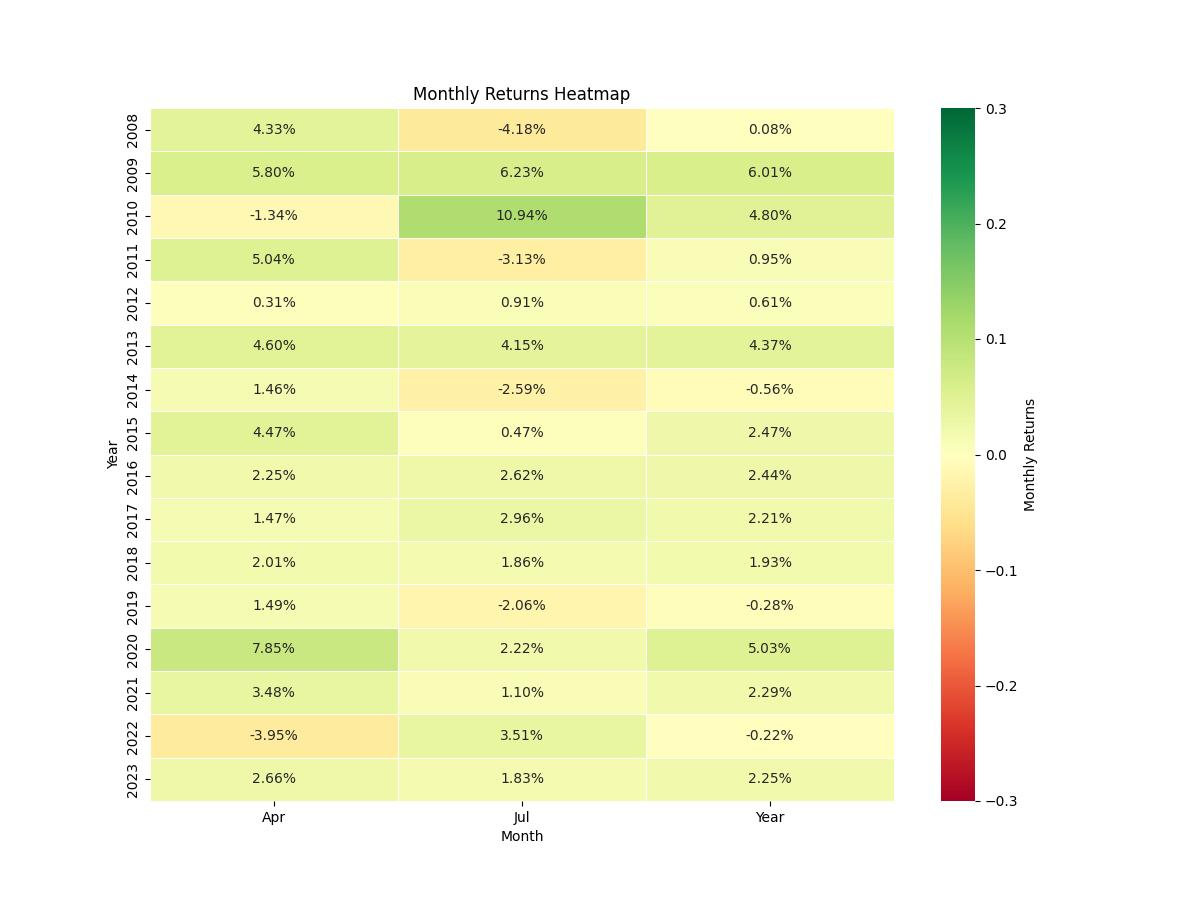
The strategy in question operates on a simple premise: it takes a long position, meaning it bets on the price of the ETF increasing, during the months of April and July. These particular months were chosen based on historical data suggesting a pattern of strong performance during these periods. The backtest scrutinizes the efficacy of this approach over a significant span, starting from December 12, 2007, and running through to December 29, 2023, encapsulating 5861 days of market activity.
During this period, the strategy was in the market, or had “exposure,” approximately 17.35% of the time. This limited exposure is a strategic choice, aiming to capitalize on the identified seasonal trends while minimizing the time the investment is at risk in the market. It’s a focused approach that contrasts sharply with the near-constant market exposure one would experience with a buy-and-hold strategy.
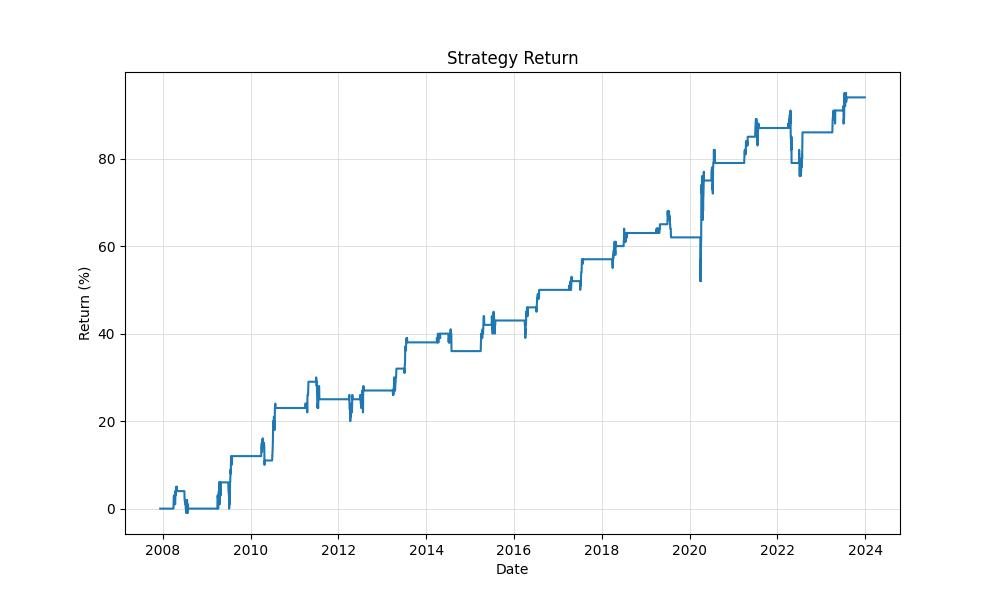
The results of the backtest bring to light some intriguing insights. With an initial capital investment of $10,000, the strategy culminated with an equity final balance of $19,415.85. This represents a noteworthy return of 94.16%, which is appreciably higher than the buy-and-hold return of 58.79% for the same ETF over the same period.
When annualized, the strategy’s return stands at 4.23%, which may seem modest at first glance. However, it is imperative to consider that this return was achieved with only a fraction of the year’s exposure to market risks. Moreover, the strategy’s disciplined seasonal approach led to less frequent trading, with the strategy being deployed selectively, in line with the seasonal patterns identified.
Key Performance Indicators
Investing in the stock market is often compared to navigating a complex maze, with each turn offering a unique set of challenges and opportunities. For those who are adept at reading the signs and understanding the patterns that emerge over time, there are strategies that can potentially lead to profitable outcomes. One such approach is the monthly seasonality trading strategy, which has been applied to the iShares Global Infrastructure ETF (IGF). Let’s delve into the performance metrics of this strategy to gain a deeper insight into its efficacy.
The strategy began with an initial capital of $10,000 and has been actively applied from December 12, 2007, to December 29, 2023. Over these 5,861 days, the strategy was only exposed to market risks for approximately 17.35% of the time. This limited exposure is a result of the strategy’s specific trading rules, which dictate entering long positions only during the months of April and July. Despite the limited market engagement, the strategy demonstrated a notable performance.
The equity at the end of the backtesting period stood at an impressive $19,415.85, with the peak equity reaching $19,509.24. This represents a total return of 94.16% over the span of the strategy, dwarfing the buy and hold return of 58.79% for the same ETF over the same period. When annualized, the return from the monthly seasonality strategy comes to 4.23%, which is a considerable achievement given the relatively low exposure to market fluctuations.
Let’s put these figures into perspective by comparing them to a simple buy and hold strategy. If an investor had opted to buy and hold IGF over the same period, their annualized return would have been 2.95%. While this is a positive outcome, it is clear that the monthly seasonality strategy outpaced the buy and hold approach by a significant margin. This outperformance can be particularly appealing to investors who are looking for ways to potentially enhance their returns while still maintaining a degree of caution regarding market exposure.
In the complex dance of market gains, understanding the rhythm and flow of when to step in and when to step back is crucial. The detailed performance metrics of this monthly seasonality strategy suggest that, for the iShares Global Infrastructure ETF, there may indeed be a seasonal rhythm that can be harnessed for potential gains, and this strategy’s backtesting results offer a compelling argument for its consideration among informed and strategic investors.
Risk Management
When it comes to investing, managing risk is paramount. One way to measure the risk of a trading strategy is by looking at its volatility. The annualized volatility of the monthly seasonality trading strategy for the iShares Global Infrastructure ETF is 6.84286%, which is considerably lower than the 22.17687% volatility experienced by a buy-and-hold approach over the same period. This suggests that the trading strategy provides a smoother investment ride compared to simply holding the ETF through thick and thin.
A key metric that combines risk and return is the Sharpe Ratio. For our trading strategy, the Sharpe Ratio stands at 0.6175, indicating that the excess return received per unit of volatility is reasonable, though not exceptional. This figure is significantly higher than the Sharpe Ratio for the buy-and-hold strategy, which is a mere 0.1329, reflecting a much less favorable risk-reward profile.
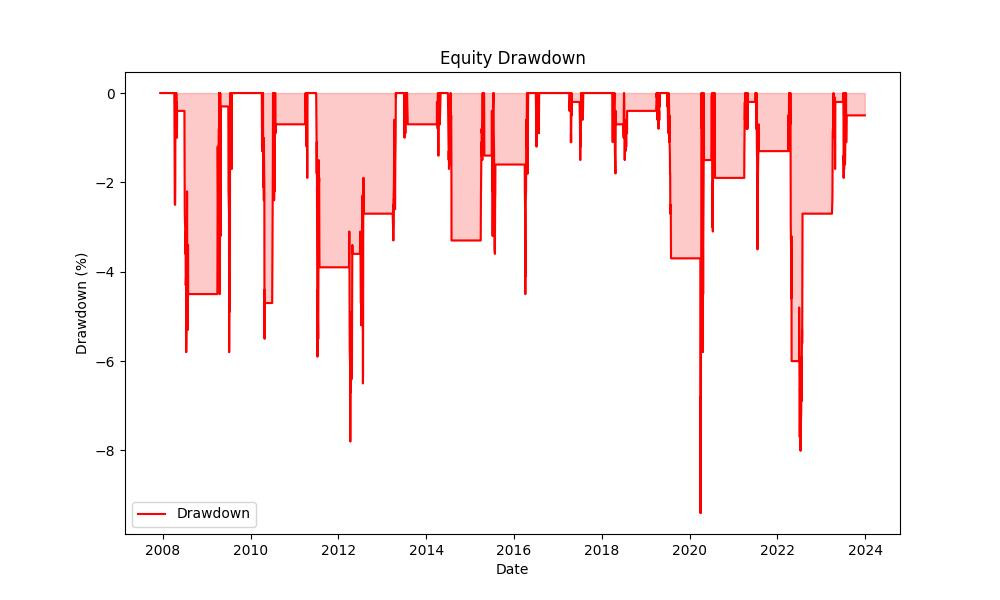
Examining drawdowns gives us insight into the possible losses one might experience. The maximum drawdown seen with this trading strategy was -9.43734%, which is the largest peak-to-trough drop in the portfolio’s value. This is a stark contrast to the -58.27980% maximum drawdown faced by buy-and-hold investors, highlighting the strategy’s effectiveness in avoiding deep valleys in portfolio value.
The average drawdown, a representation of the typical decline from peaks, was -1.64636% for the trading strategy, much milder than the -3.67076% average drawdown for buy-and-hold. Furthermore, the longest period the strategy spent in a drawdown was 663 days, whereas the buy-and-hold approach could have left an investor underwater for as long as 2276 days. The average time a drawdown lasted for the trading strategy was simply 60 days, showing that losses were not only shallower but also shorter-lived.
These figures paint a picture of a trading strategy that has managed risk effectively over the backtested period. It has delivered smoother returns with fewer and less severe dips in portfolio value, suggesting that investors who are risk-averse might find it a suitable approach, especially when compared to the more volatile buy-and-hold strategy.
Trade Analysis
Delving into the mechanics of our monthly seasonality trading strategy for the iShares Global Infrastructure ETF (IGF), the backtested results offer a compelling narrative for retail investors. This analysis will illuminate the intricacies of the strategy’s performance, scrutinizing the number of trades, the win rate, and various other metrics that gauge the strategy’s efficacy.
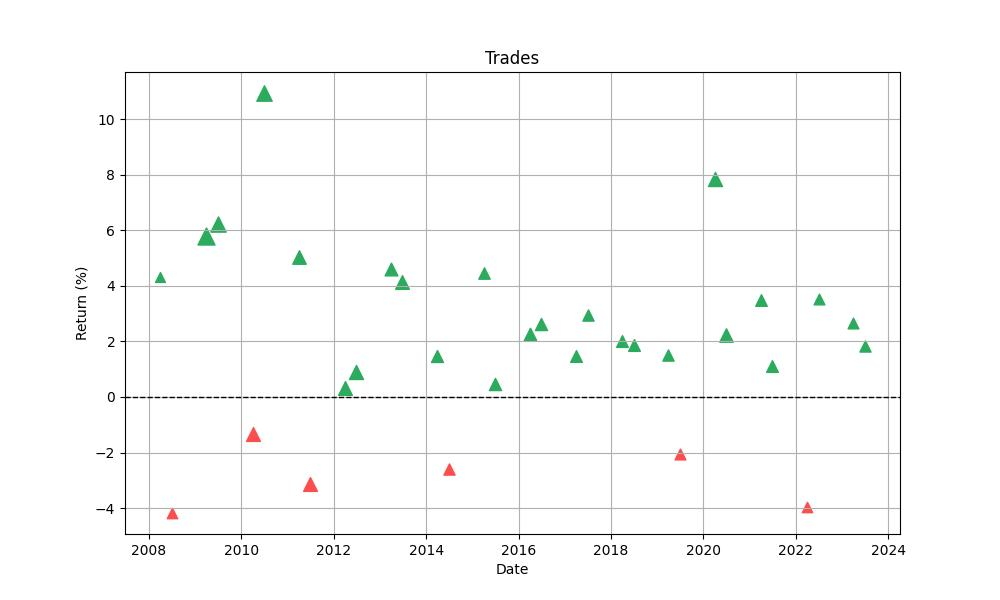
Over the testing period, the strategy executed a total of 32 trades, which is a modest number considering the multi-year span of the backtest. This figure aligns with our approach of entering the market only during specific months – April and July – when historical data suggested a propensity for favorable moves. The discipline to engage the market selectively is a cornerstone of our strategy, ensuring that capital is only put to work during times of perceived seasonal strength.
A standout feature of our strategy is the impressive win rate of 81.25%. This suggests that more than 8 out of 10 trades adhered to our expectations of market movement during the chosen months. High win rates are often indicative of a robust strategy that captures consistent market patterns, and in this case, it underlines the potential reliability of the seasonal trends we’ve identified.
The magnitude of gains and losses per trade further refines our understanding of the strategy’s performance. The best trade yielded an impressive 10.94% return, showcasing the strategy’s ability to capitalize on strong upward movements. Conversely, the worst trade resulted in a loss of 4.18%, which, while unwelcome, is relatively contained and highlights the strategy’s risk mitigation capabilities.
Furthermore, the average trade delivered a 2.10% return, reinforcing the strategy’s consistent performance across the board. These gains are not just outliers but a pattern of positive returns contributing to the overall profitability of the strategy.
Trade duration is another pivotal aspect of our analysis. The longest trade remained open for 33 days, while on average, trades lasted 31 days. This tight distribution suggests a consistent holding period that aligns well with the strategy’s monthly approach, further affirming the methodical nature of the trade entries and exits.
The Profit Factor, sitting at an impressive 4.98, offers a solid testament to the strategy’s profitability. This metric indicates that the gross profits from winning trades are nearly five times the gross losses from losing trades – a ratio that speaks volumes about the strategy’s effectiveness in maximizing gains and minimizing losses.
The Expectancy of 2.15% provides additional insights into the strategy’s performance. This figure represents the average amount a trader can expect to win (or lose) per trade, accounting for both winning and losing trades. An expectancy greater than zero is highly desirable as it implies that the strategy, on average, yields positive returns per trade.
Lastly, the System Quality Number (SQN) scores a robust 3.79, which classifies the strategy’s performance as excellent. This metric evaluates the system’s reliability and risk-adjusted profitability, incorporating factors like the win rate, average win/loss ratio, and the number of trades. A high SQN is indicative of a system that can potentially offer consistent and favorable returns over time.
Conclusion
In conclusion, the seasonal trading strategy applied to the iShares Global Infrastructure ETF (IGF) has demonstrated a remarkable ability to outperform a traditional buy-and-hold strategy, achieving a higher total return with notably lower exposure to market risks. The backtested results, spanning over 15 years, have underscored the potential of a disciplined approach that leverages historical patterns to guide investment decisions.
Investors who seek to optimize their returns while managing risk could find the strategy’s performance compelling, given its superior risk-adjusted returns, lower volatility, and reduced drawdowns. The robust win rate, favorable Profit Factor, and excellent System Quality Number (SQN) all indicate a trading system that is not only profitable but also reliable over the long term.
Moreover, the strategy’s ability to deliver consistent returns with a relatively small number of trades and a focused exposure period each year is particularly appealing in a market environment where many investors are overwhelmed by the constant noise and volatility. By capitalizing on specific seasonal trends, this strategy has carved out a niche that offers a smoother investment experience, which could be an attractive option for both seasoned and novice investors alike.
In essence, the analysis of this seasonal trading strategy for IGF has revealed a methodical and measured approach to the stock market that has historically yielded positive outcomes. While past performance is not indicative of future results, the evidence presented through backtesting makes a strong case for considering seasonality as a significant factor in building a trading strategy with the aim of enhancing returns and managing market risk effectively.

“Make the invisible visible. My goal is to shine a light on the subtle seasonal signals in the stock market, providing investors with the insight needed to make informed decisions. By breaking down the complexities of seasonality, I strive to empower our audience with knowledge and foresight, turning data into action.”