


Investing in the stock market is akin to navigating a complex labyrinth, where the turns and twists of market sentiment often dictate the flow of capital. For the astute investor, understanding the cyclical patterns that underpin the market’s behavior is not just a matter of curiosity, but a strategic imperative. Today, we delve into the world of seasonal trading strategies, focusing on an intriguing example from the biotechnology sphere, where timing is not just a concept, but the cornerstone of investment success.
Company Overview
Amgen Inc. stands as a biopharmaceutical titan, renowned for its trailblazing role in the industry. This company, a beacon of innovation and excellence, has etched its name in the annals of medical history through its development of treatments that have revolutionized patient care. From oncology to nephrology, Amgen has been at the forefront, offering a suite of products that address some of the most pressing medical needs. Its commitment to research and development has yielded a portfolio of drugs that not only improve patient outcomes but also reflect the company’s unwavering dedication to life-sciences advancement.
Strategy Overview
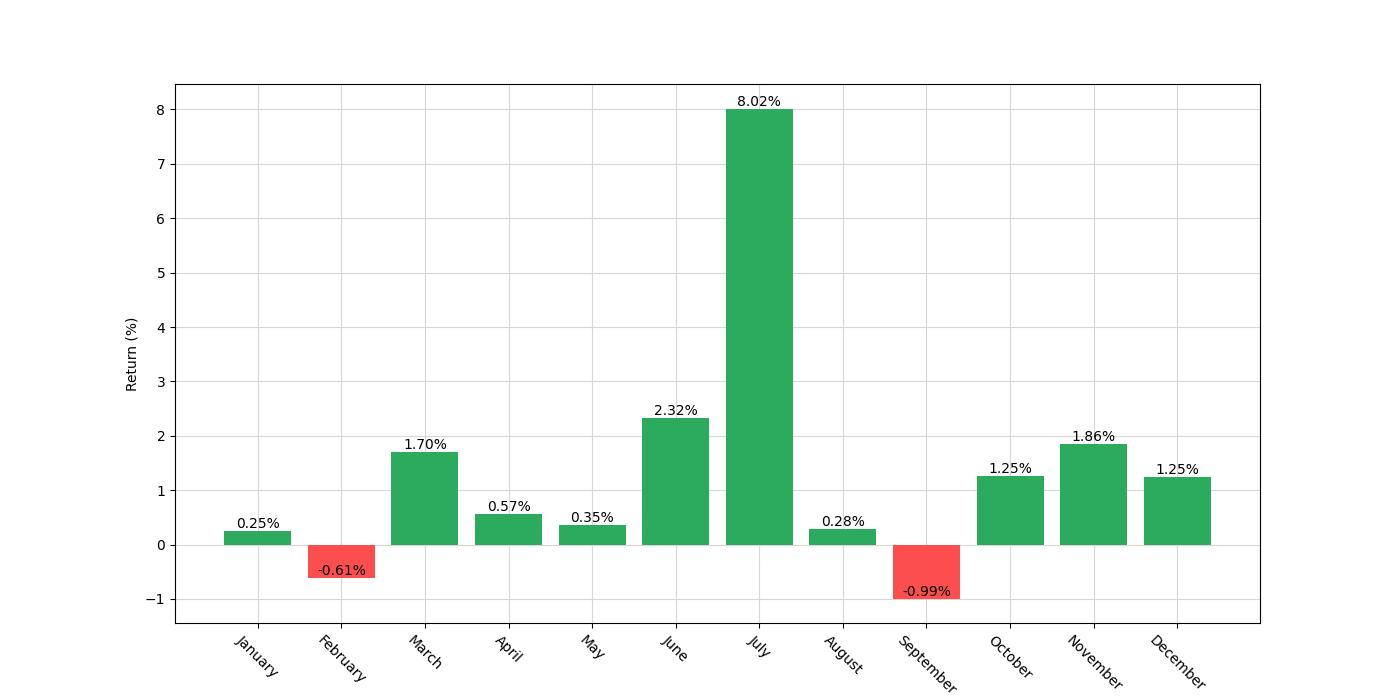
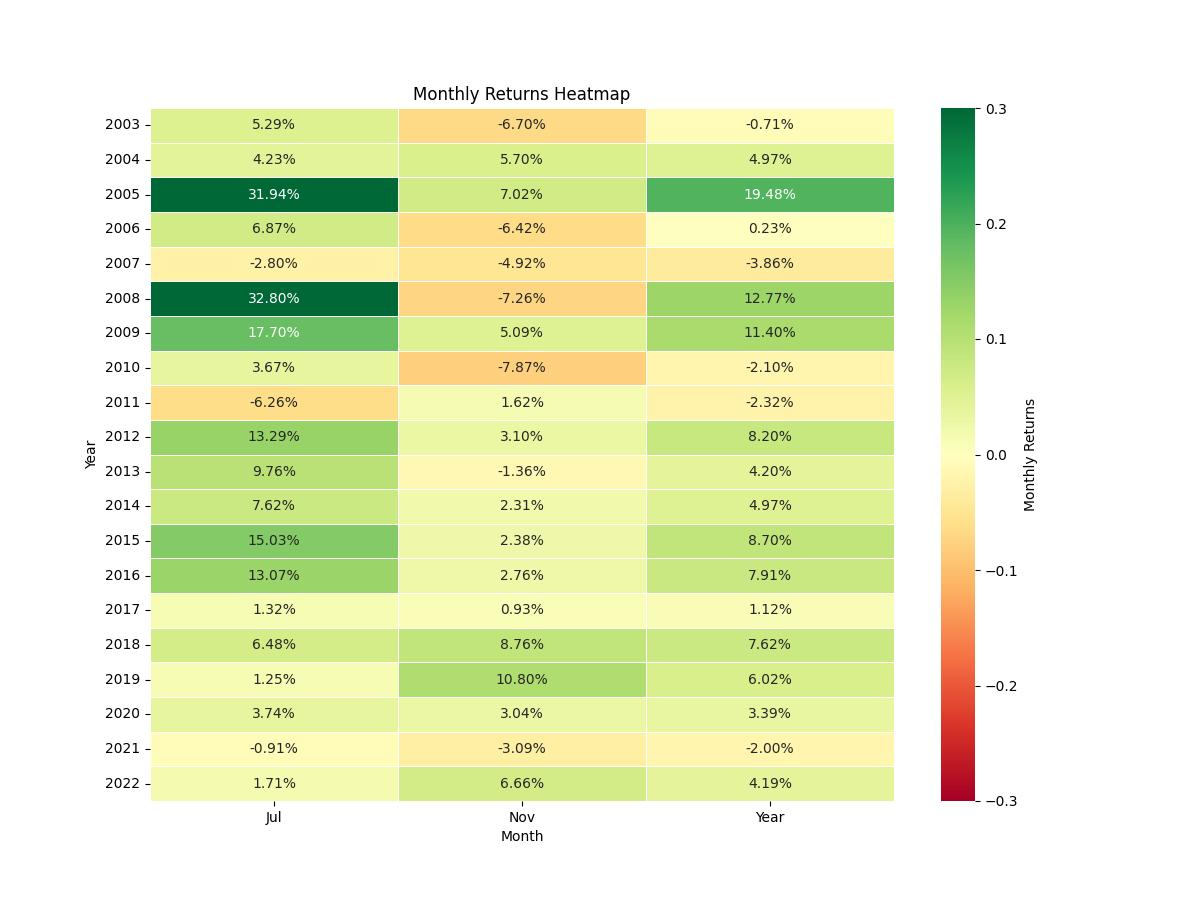
In the world of stock trading, strategies that capitalize on seasonal trends can offer a unique edge. The strategy in question for Amgen Inc. (AMGN) takes a monthly seasonality approach, leveraging patterns identified in the stock’s historical performance. Operating between the start date of January 2, 2003, and the end date of December 30, 2022, this strategy weaves through the market’s temporal fabric, spanning a duration of 7,302 days. It engages in the market selectively, with an exposure time of approximately 17.3%, representing the focused periods during which positions are held. Specifically, the strategy dictates taking a long position during the months of July and November, periods identified to potentially offer favorable returns.
Key Performance Indicators
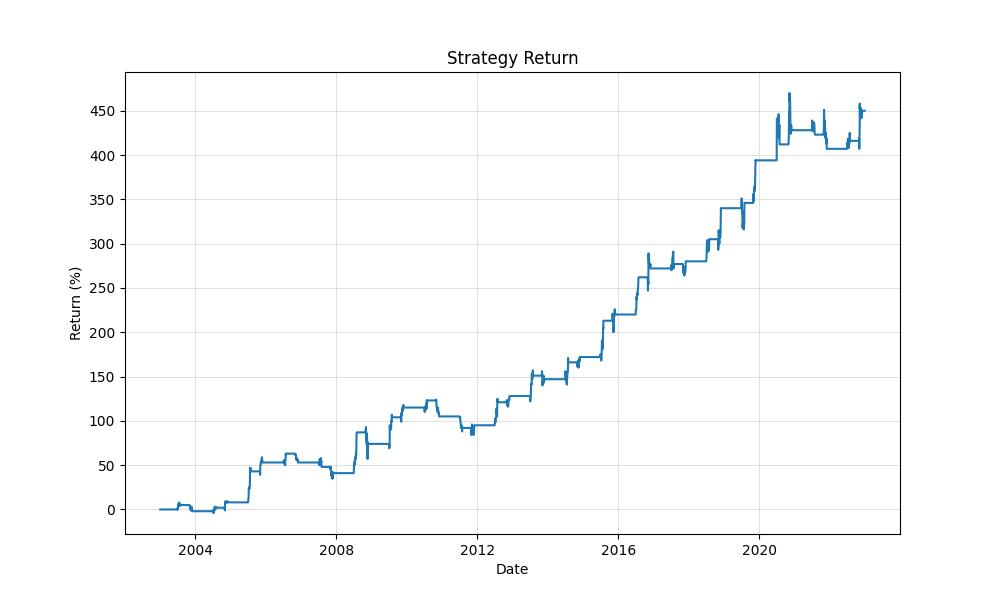
The strategy’s performance is quantified by impressive metrics: An initial investment of $10,000 burgeoned to an equity final of approximately $54,999.96, marking a 450% return, while the peak equity reached nearly $57,046.82. In comparison, the buy and hold strategy yielded a 610% return. Annually, the strategy posted an 8.91% return, modestly underperforming the buy and hold return of 10.33%. These figures provide a window into the strategy’s potential in both absolute terms and relative to a passive investment approach.
| Strategy | Buy and Hold | |
|---|---|---|
| Start Date | 2003-01-02 | 2003-01-02 |
| End Date | 2022-12-30 | 2022-12-30 |
| Duration | 7302 days | 7302 days |
| Exposure Time [%] | 17.3 | 99.96 |
| Equity Final [$] | 54999.96 | 71270.73 |
| Equity Peak [$] | 57046.82 | 78648.57 |
| Return [%] | 450.0 | 612.71 |
| Return (Ann.) [%] | 8.91 | 10.33 |
| Volatility (Ann.) [%] | 12.35 | 29.02 |
| Sharpe Ratio | 0.72 | 0.36 |
| Sortino Ratio | 1.55 | 0.6 |
| Calmar Ratio | 0.48 | 0.19 |
| Max. Drawdown [%] | -18.55 | -53.59 |
| Avg. Drawdown [%] | -3.33 | -5.47 |
| Max. Drawdown Duration | 780 days | 2531 days |
| Avg. Drawdown Duration | 91 days | 69 days |
| # Trades | 40 | 1 |
| Win Rate [%] | 75.0 | 100.0 |
| Best Trade [%] | 32.8 | 613.23 |
| Worst Trade [%] | -7.87 | 613.23 |
| Avg. Trade [%] | 4.36 | 613.23 |
| Max. Trade Duration | 33 days | 7300 days |
| Avg. Trade Duration | 31 days | 7300 days |
| Profit Factor | 4.96 | nan |
| Expectancy [%] | 4.71 | 613.23 |
| SQN | 4.04 | nan |
Risk Management
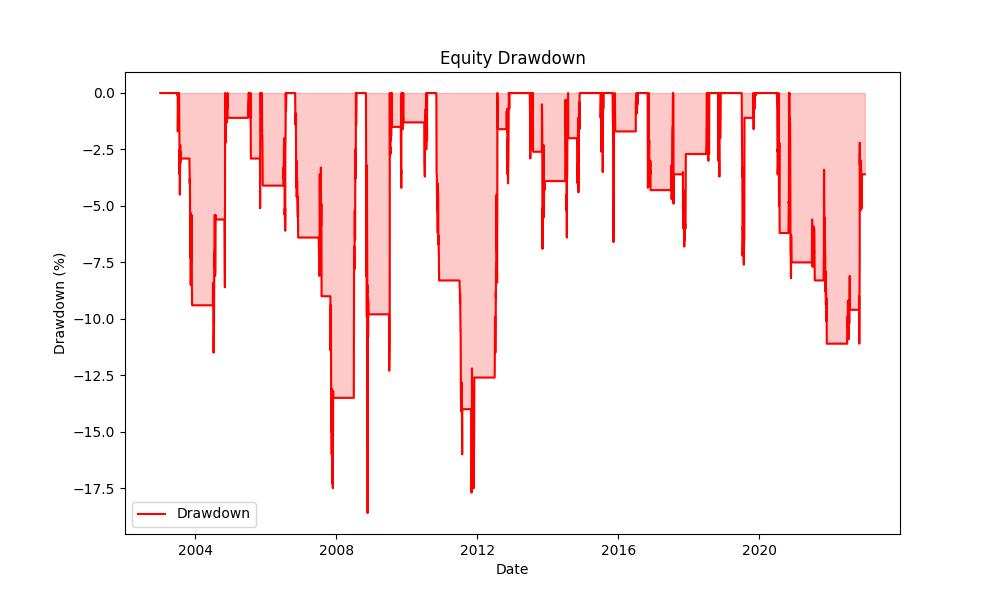
Risk is an inseparable companion of reward, and this strategy is no stranger to it. With an annualized volatility of 12.35%, the strategy offers a smoother ride compared to the market’s inherent fluctuations. The Sharpe Ratio, a measure of risk-adjusted return, stands at 0.72, suggesting that the strategy provides a reasonable excess return for the risk undertaken. The Calmar Ratio, at 0.48, indicates the strategy’s performance in relation to its maximum drawdown, which is a relatively modest 18.55%. The average drawdown, an indicator of the typical decline experienced, is around -3.33%, with an average duration of 91 days.
Trade Analysis
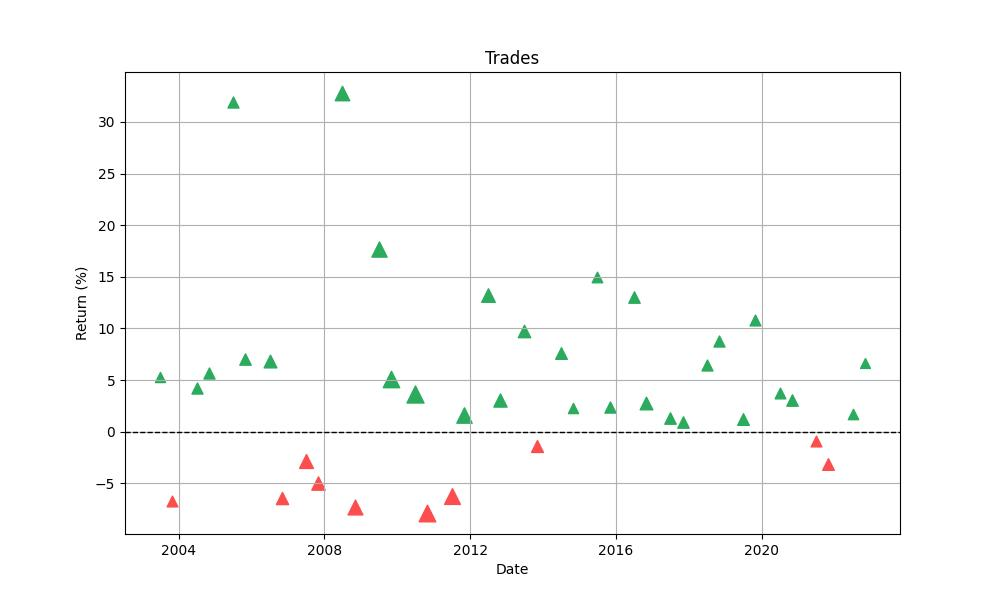
Over the course of the strategy’s life, 40 trades were executed, boasting an impressive 75% win rate. The best trade saw a gain of 32.80%, while the worst trade resulted in a 7.87% loss. On average, trades yielded a 4.36% return, indicative of the strategy’s consistency. The maximum duration for a trade was 33 days, aligning closely with the strategy’s monthly approach, and the average trade duration was 31 days. The Profit Factor stands at a robust 4.96, with an expectancy of 4.71%, reinforcing the strategy’s efficacy.
Conclusion
In conclusion, the monthly seasonality trading strategy for Amgen Inc. demonstrates the potential that lies in understanding and harnessing market seasonality. While it does not outperform the buy and hold strategy in terms of overall return, it offers a lower volatility and drawdown profile, which may be attractive to investors seeking a more conservative approach. As with any strategy, it is crucial for investors to consider their individual risk tolerance and investment goals before embarking on such a trading journey. This detailed analysis serves as a testament to the intricate dance between time and market dynamics, a choreography where precision and timing play pivotal roles.

“Make the invisible visible. My goal is to shine a light on the subtle seasonal signals in the stock market, providing investors with the insight needed to make informed decisions. By breaking down the complexities of seasonality, I strive to empower our audience with knowledge and foresight, turning data into action.”