Introduction
As the leaves change color and the chill of winter approaches, or as the markets thaw out and the first buds of spring appear, investors are reminded that the world, and indeed the stock market, moves in cycles. While many factors contribute to market fluctuations, a phenomenon that has long intrigued and enticed investors is seasonal stock market trends. The concept of seasonality suggests that certain times of the year are systematically more profitable for investors than others due to reasons ranging from tax implications to holiday retail rushes.
In this comprehensive exploration, we delve into the seasonality of the stock market with a keen eye on Science Applications International Corporation (SAIC), a powerhouse in the engineering and IT services sector. Our mission is to demystify the historical patterns that could inform future trading strategies and to provide investors with a clear roadmap for leveraging these cyclical market tendencies. By marrying meticulous backtesting data with a pragmatic approach to trading, we aim to illuminate the potential of a carefully crafted investment strategy built around the temporal heartbeats of the stock market.
Join us as we navigate the ebb and flow of SAIC’s stock performance through the lens of monthly seasonality. We will dissect the strategy that has outperformed traditional buy-and-hold tactics, scrutinize the key performance indicators that validate its success, and evaluate the risk management mechanisms that provide stability amidst the market’s inevitable turbulence. Whether you are a seasoned investor or just starting to dabble in the financial markets, understanding the importance of timing can be a game-changer for your portfolio. So, grab your financial calendar, and let’s embark on a journey to decode the rhythms of the stock market and harness the power of seasonality in trading.
Company Overview
SAIC: Advancing Innovation in Technology-Driven Solutions
SAIC (Science Applications International Corporation) is a global technology integrator driving transformative outcomes for customers in the national security, space, health, and energy sectors. Headquartered in Reston, Virginia, SAIC operates through various business segments, including its core offerings in systems engineering and integration, mission platforms and solutions, and data analytics and artificial intelligence. SAIC’s target market encompasses government agencies, defense organizations, and commercial enterprises seeking advanced technological solutions.
The company’s revenue streams primarily stem from government contracts, particularly in the defense and intelligence sectors. SAIC’s value proposition lies in its ability to provide end-to-end solutions, combining expertise in scientific research, systems engineering, and digital transformation to address complex challenges. It operates on a project-based model, delivering customized solutions tailored to specific client requirements.
SAIC’s growth strategy focuses on expanding its presence in high-growth areas such as artificial intelligence, cyber security, and digital transformation. The company aims to capitalize on the increasing demand for advanced technology solutions across various industries. Additionally, SAIC seeks to capture new market opportunities through strategic partnerships and acquisitions, bolstering its capabilities and expanding its reach.
The industry landscape in which SAIC operates is characterized by rapid technological advancements, evolving customer needs, and increasing competition. To stay ahead, SAIC emphasizes innovation, investing heavily in research and development to maintain its competitive edge. The company’s commitment to quality and customer satisfaction has earned it recognition and numerous industry accolades.
Strategy Overview
In the intricate dance of the stock market, savvy investors often look to historical patterns to guide their future trades. One such pattern of interest is monthly seasonality, a concept that suggests certain months may bring better returns than others due to a variety of factors such as fiscal year ends, tax considerations, or holiday spending. Our focus today is on a trading strategy that leverages this phenomenon with respect to Science Applications International Corporation (SAIC), a notable player in the realm of services and solutions in the fields of engineering, IT, and mission solutions.
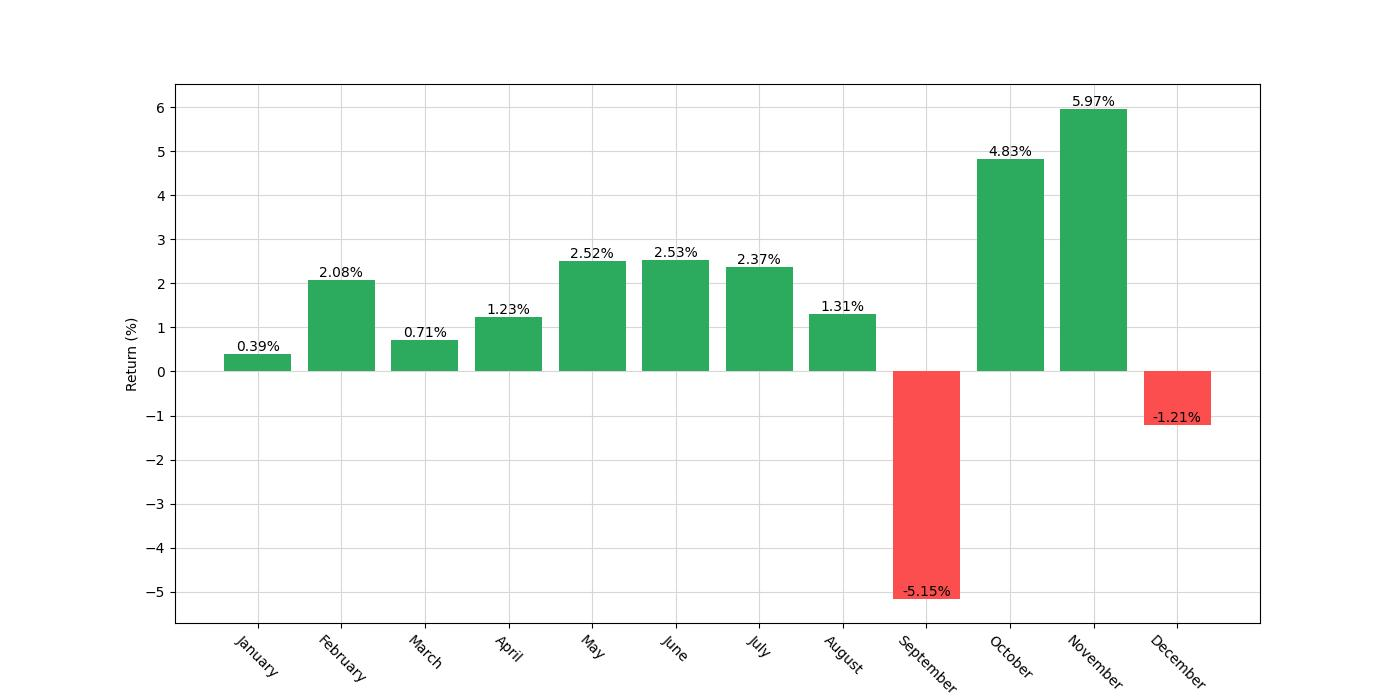
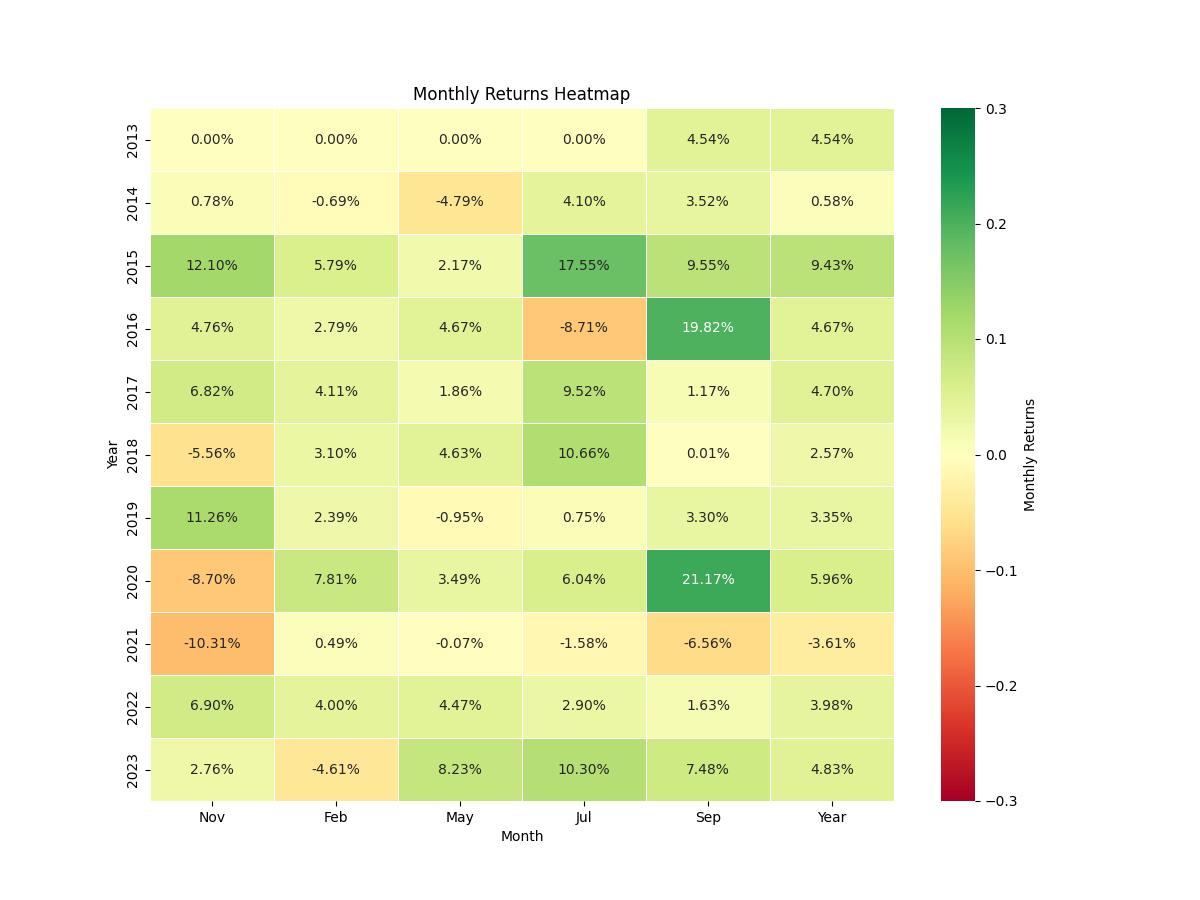
The strategy in question is elegantly straightforward and is predicated on the historical performance data of SAIC. Investors adopting this strategy would initiate a long position, meaning they would buy SAIC stock, specifically in the months of February, May, July, and November, anticipating that these months historically have been favorable for the stock’s performance. Conversely, they would take a short position, betting against the stock, in September, which the data suggests tends to underperform.
This backtesting analysis spans a decade, starting from September 16, 2013, and running through to December 29, 2023, encapsulating a duration of 3,756 days. Investors employing this strategy would not be perpetually engaged in the market; instead, their exposure time would be approximately 42.18% of the total duration. This intermittent involvement is strategic, enabling exposure to potential gains while also seeking to mitigate the risk inherent in constant market fluctuations.
It’s important to note that the backtesting results presented here do not factor in trading costs such as commissions and slippage, which can affect the profitability of any trading strategy. These findings are based on the assumption of trading at the precise closing prices of the months stipulated without any transactional loss.
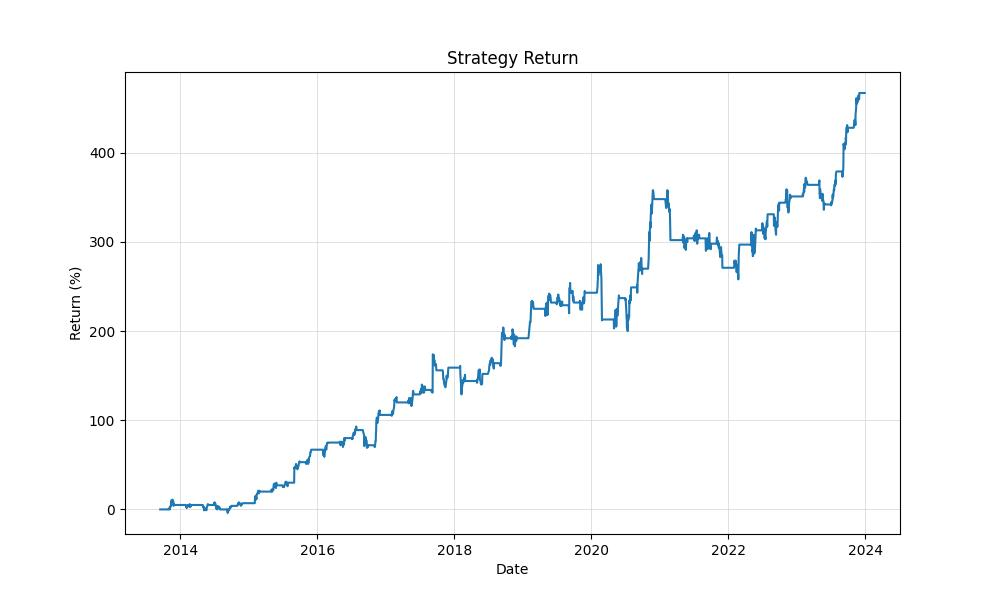
The initial capital allocated for this strategy is set at $10,000, a baseline figure that allows for a clear assessment of growth over the backtesting period. The results of this approach are promising, with the final equity reported at $56,733.25, matching the equity peak achieved. When comparing the strategy’s performance to a simple buy-and-hold approach with SAIC, it becomes evident that there’s an enhancement in returns. Specifically, the strategy yielded a return of 467.33%, outperforming the buy-and-hold return of 382.48%. On an annualized basis, the strategy’s return stands at 18.39%, showcasing its effectiveness over the years.
The application of this monthly seasonality trading approach to SAIC stock illustrates the potential benefits of harnessing historical patterns within the stock market. By strategically entering and exiting positions based on the time-tested behavior of the stock, investors could potentially enhance their portfolios, outpacing traditional buy-and-hold strategies. These backtested results provide a compelling case for considering seasonality when crafting investment strategies for companies like SAIC.

Key Performance Indicators
When assessing the vitality of a trading strategy, one cannot overlook the robustness of its key performance indicators (KPIs). These metrics serve as a compass, guiding investors through the tempestuous seas of the stock market with quantifiable evidence of success or cautionary tales of risk.
Let’s dive into the performance of our featured trading strategy applied to Science Applications International Corporation (SAIC). Over a period spanning from September 16, 2013, to December 29, 2023, this strategy has shown a remarkable ability to capitalize on the inherent seasonality of the stock market. The initial investment of $10,000 burgeoned to an impressive equity final of $56,733.25. To put this into perspective, the equity peak also tapped at this same level, underscoring a strategy that effectively captured the growth potential without significant retracement.
Investors often juxtapose the returns of a strategic approach to the classic buy-and-hold method to gauge effectiveness. Here, the monthly seasonality strategy yielded a heartening return of 467.33%, a figure that comfortably surpasses the buy-and-hold return of 382.48% for the same period. This demonstrates the strategy’s prowess in navigating the market’s cyclic tendencies.
Moreover, when it comes to annualized returns, the strategy did not disappoint. The return on an annual basis stood at 18.39%, a testament to the consistent performance year-over-year. This is in contrast to the buy-and-hold annualized return of 16.78%, again showcasing the edge that a well-honed seasonal strategy can provide.
These figures are not just about the returns but also about the journey to achieving them. The strategy’s performance is a narrative of calculated risk-taking and strategic positioning that has been designed to tap into the rhythmic patterns of the market. For retail investors, such a strategy could very well be the compass needed to navigate the financial markets’ seasonal ebbs and flows efficiently.

Risk Management
When evaluating the merits of a trading strategy, one of the most crucial elements to consider is how the strategy manages risk. In the case of the monthly seasonality strategy applied to Science Applications International Corporation (SAIC), the risk management profile is quite revealing.
Let’s start by examining the Annualized Volatility, which stands at 20.13%. This figure indicates the degree to which the strategy’s returns fluctuate over time. In comparison to the underlying stock’s volatility, this strategy appears to have moderated the peaks and valleys that an investor would experience. This is important because it suggests that the strategy may offer a smoother investment ride compared to simply holding the stock.
The Sharpe Ratio provides additional insight into risk-adjusted returns, coming in at 0.91 for this strategy. This metric is particularly telling as it reveals how much excess return is being received for the extra volatility endured by holding a riskier asset. A Sharpe Ratio of 0.91 signals that the strategy is generating a decent level of return for the risk taken, although investors typically look for a value above 1 to consider a strategy as offering excellent risk-adjusted returns.
Delving into drawdowns, we uncover the strategy’s Max. Drawdown at -21.81%. Drawdowns are a stark reminder of the potential losses that might occur before a strategy regains its footing. While a maximum drawdown of this magnitude is significant, it pales in comparison to the buy-and-hold strategy’s much steeper -45.89% drawdown over the same period. This suggests that the seasonal strategy could potentially shield investors from the most severe downturns.
The Average Drawdown, sitting at -3.36%, along with the Max. Drawdown Duration of 636 days and the Average Drawdown Duration of 51 days, further contextualize the risk. These drawdown metrics indicate the strategy’s ability to recover from losses. With the average drawdown being relatively shallow and short-lived, this implies that negative trades tend to be offset by gains in a relatively short time frame, which can be reassuring for investors who might otherwise be concerned about prolonged periods of losses.
The Calmar Ratio, another risk-reward indicator, stands at 0.84 for this strategy. This ratio compares the annualized return to the maximum drawdown over a period. With a ratio closer to 1, the strategy demonstrates a strong performance in light of the risks encountered, although higher values are generally more desirable.

Trade Analysis
In the fascinating world of stock market seasonality, the meticulous examination of trade performance is crucial for investors seeking to understand the efficacy of a trading strategy. When delving into the backtested results of the monthly seasonality trading strategy applied to Science Applications International Corporation (SAIC), we come across some intriguing insights that highlight the strategy’s robustness and potential risks.
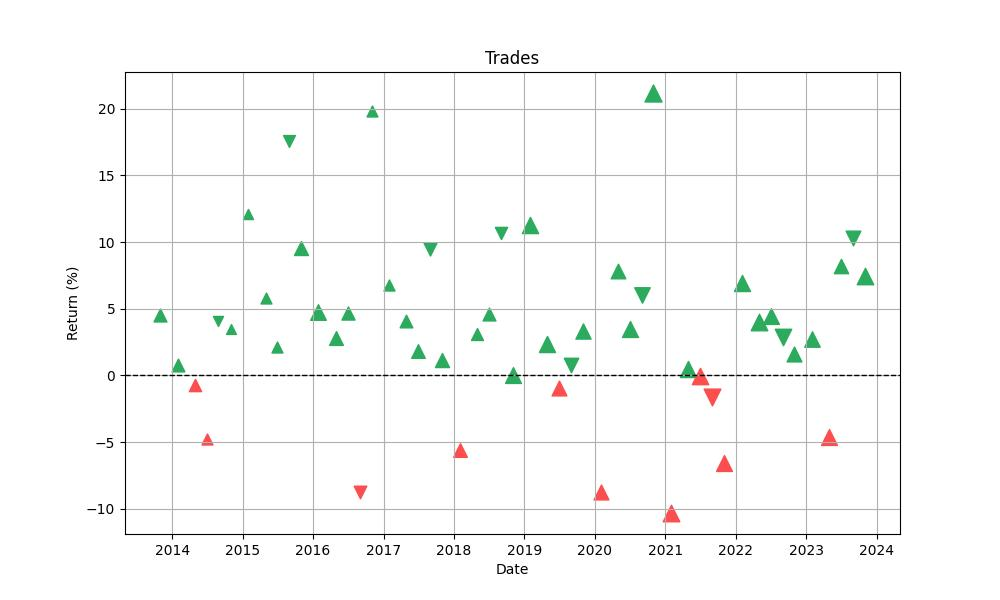
Over the tested period, the strategy executed a total of 51 trades. This frequency demonstrates a selective approach, ensuring that the strategy is active only during specific, historically favorable months rather than engaging the market continuously. The discipline of the strategy is further enhanced by its impressive win rate of approximately 78.43%. Notably, this high win rate signifies that the strategy has been correct in its directional market bets more often than not, which is a reassuring factor for investors contemplating this seasonal approach.
Peering into the individual trade outcomes, we observe that the most profitable trade yielded a remarkable 21.17% return. On the other hand, even the most effective strategies encounter setbacks, and this one is no exception. The worst-performing trade resulted in a 10.31% loss. Despite this, the average trade performance stands at a gain of 3.47%, a figure that indicates consistent positive returns across the majority of trades.
The duration of trades is also worth noting. The strategy maintains positions for an average of 30 days, aligning perfectly with its monthly seasonality premise. The longest trade spanned 33 days, suggesting a slight extension beyond a calendar month, potentially to capture additional gains or mitigate losses.
The profitability of a trading strategy is not solely determined by the success rate of its trades but also by how the gains compare to the losses. This is where the Profit Factor comes into play, and for this strategy, it’s an impressive 4.56. This means that the total gains from winning trades are more than four times the total losses from losing trades, indicating a healthy risk-reward balance that could cushion the strategy against periods of market adversity.
Expectancy, which measures the average expected return per trade, is another critical metric. For this strategy, the expectancy is 3.66%, suggesting that each trade carries a favorable expectation of profit. This positive expectancy is a testament to the strategy’s sound design and its potential to compound gains over time.
In the realm of quantitative trading, the System Quality Number (SQN) is an often-overlooked but insightful metric. With an SQN value of 3.27, the strategy falls into the ‘good’ category, indicating a system that has the potential to deliver consistent profitability.
Through the lens of trade analysis, the monthly seasonality strategy for SAIC demonstrates a compelling combination of high win rate, profitable expectancy, and a solid profit factor. These elements combined make a strong case for the strategy’s effectiveness, albeit with the understanding that past performance is not indicative of future results and that market conditions are ever-changing. Nonetheless, the data presents a narrative of a well-calibrated strategy that could serve as a guide for investors looking to harness the rhythmic patterns of the stock market.

Conclusion
In conclusion, the exploration of the monthly seasonality trading strategy applied to Science Applications International Corporation (SAIC) has revealed a promising avenue for investors seeking an edge in the stock market. By capitalizing on historical performance data to time market entry and exit, this strategy has outperformed traditional buy-and-hold approaches, suggesting that there is merit to the adoption of seasonal patterns in investment decision-making.
Our analysis demonstrates that the strategy not only boasts impressive returns but also exhibits a level of risk mitigation that could appeal to investors who are cautious about market volatility. The backtested results, with a high win rate and a favorable risk-reward profile, underscore the potential for this strategic approach to contribute positively to an investor’s portfolio.
However, it is crucial for investors to remember that backtesting is not a guarantee of future performance, and all trading strategies carry inherent risks. Factors such as transaction costs, market changes, and economic shifts can all influence the actual performance of a strategy. Therefore, while the data presents a compelling narrative, investors should approach the application of this strategy with due diligence and consider it as part of a broader, diversified investment approach.
As we close the chapter on this analysis, we hope that our insights into the monthly seasonality trading strategy for SAIC have illuminated the potential benefits of integrating seasonal trends into investment practices. Whether you’re a seasoned trader or a newcomer to the stock market, understanding and leveraging the seasonality of stocks can serve as a valuable component in your quest for financial growth.


“Make the invisible visible. My goal is to shine a light on the subtle seasonal signals in the stock market, providing investors with the insight needed to make informed decisions. By breaking down the complexities of seasonality, I strive to empower our audience with knowledge and foresight, turning data into action.”

