


Investors often seek patterns in the stock market to gain a competitive edge. One such pattern is seasonality, a characteristic of a time series in which the data experiences regular and predictable changes resulting from seasonal factors. Today, we delve into a compelling strategy that leverages seasonality within the stock market, focusing on the symbol IQV – a company ripe for seasonal investment analysis.
Company Overview
IQV, known for its pivotal role in the healthcare sector, provides advanced analytics, technology solutions, and contract research services. As a leader in the life sciences industry, IQV assists biotech and pharmaceutical companies in navigating the complex journey from discovery to commercialization. With a suite of services that includes clinical trial data management, real-world evidence, and therapeutic expertise, IQV is instrumental in accelerating healthcare innovation and bringing medical breakthroughs to market.
Strategy Overview
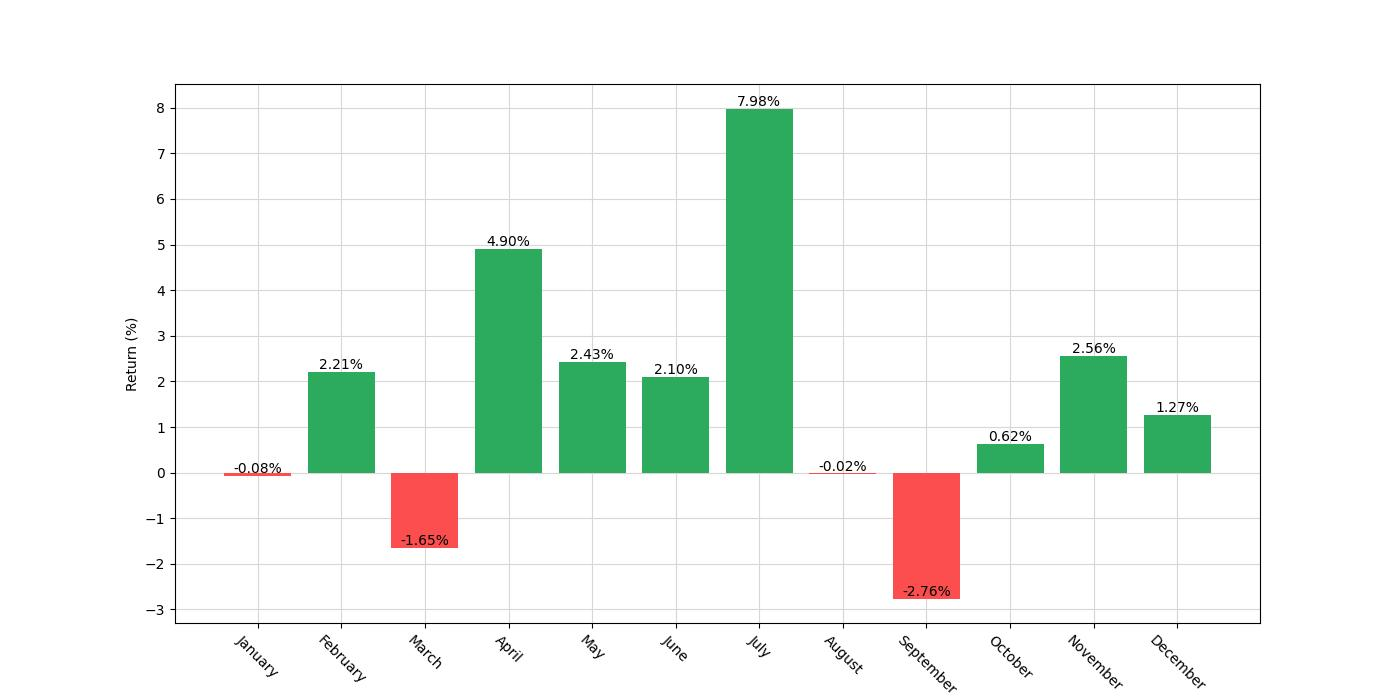
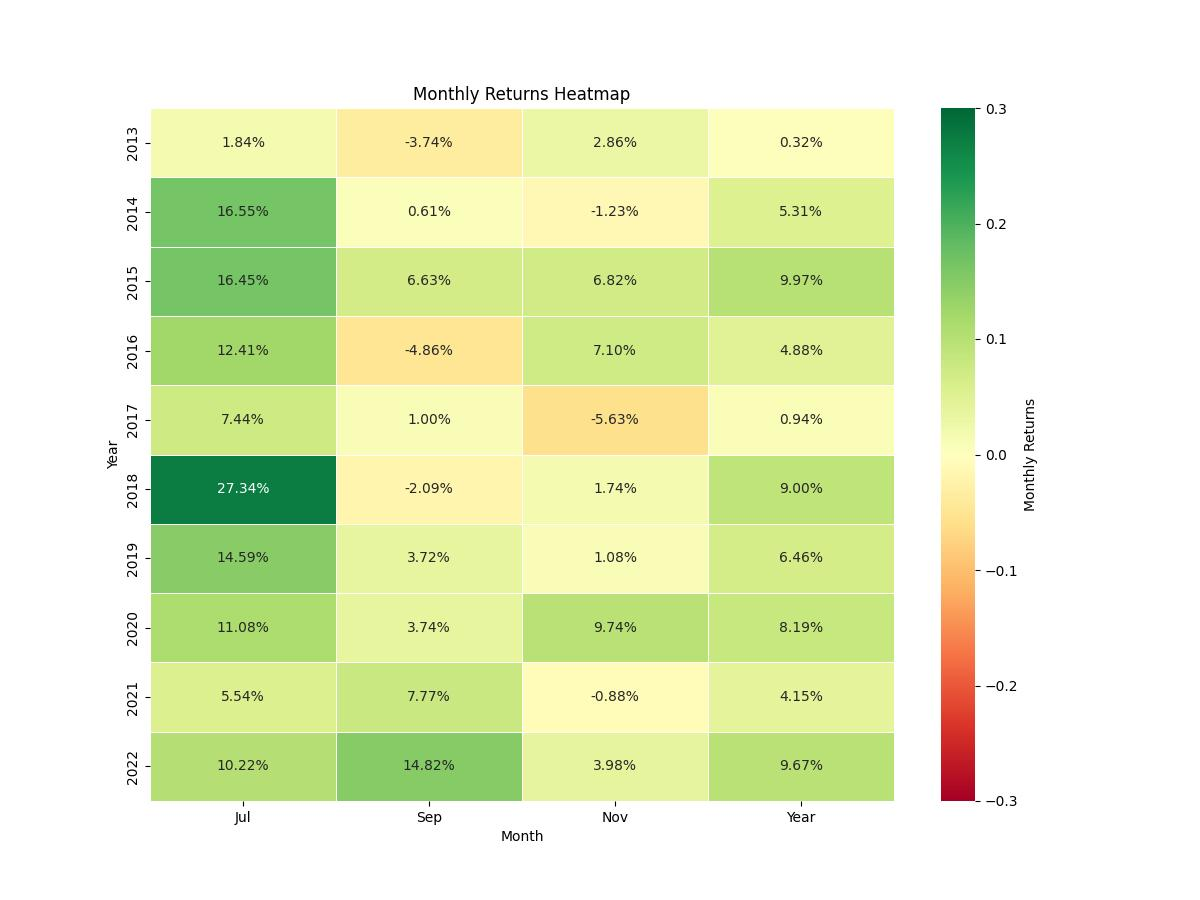
The trading strategy in question leverages monthly seasonality from close-to-close for the symbol IQV, focusing on long positions in the months of May, June, July, and November while taking a short position in the month of September. Implemented from May 9, 2013, to December 30, 2022, this strategy spans 3,522 days and exposes investors to the market 43.33% of the time.
Key Performance Indicators
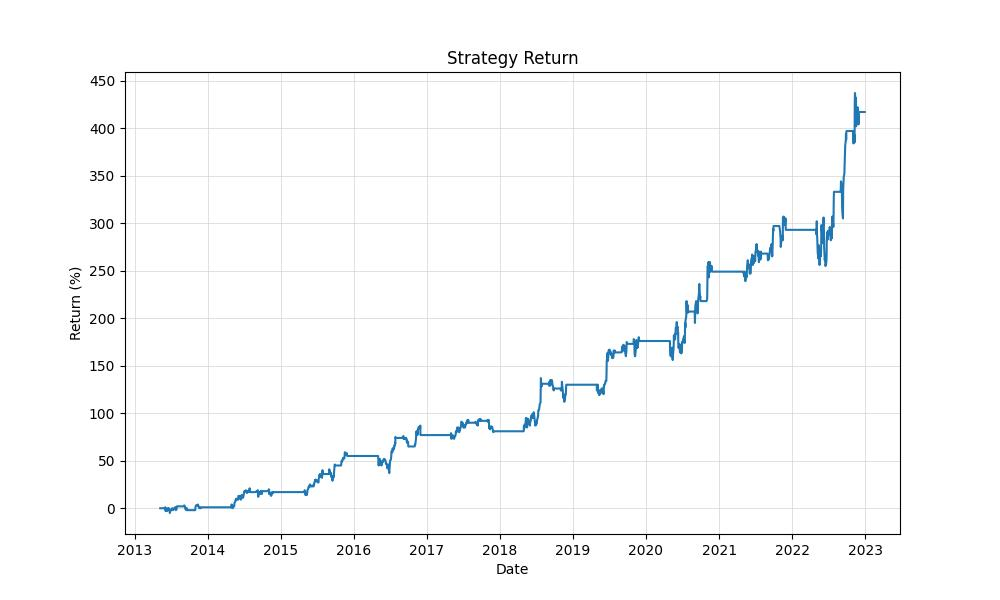
The strategy boasts an impressive final equity of $51,719.42, peaking at $53,736.29. With an overall return of 417.19%, it edges out the buy and hold return of 386.56%. On an annualized basis, the strategy yields an 18.58% return, demonstrating its potential to outperform passive investment strategies.
| Strategy | Buy and Hold | |
|---|---|---|
| Start Date | 2013-05-09 | 2013-05-09 |
| End Date | 2022-12-30 | 2022-12-30 |
| Duration | 3522 days | 3522 days |
| Exposure Time [%] | 43.33 | 99.92 |
| Equity Final [$] | 51719.42 | 48873.7 |
| Equity Peak [$] | 53736.29 | 66451.7 |
| Return [%] | 417.19 | 388.74 |
| Return (Ann.) [%] | 18.58 | 17.89 |
| Volatility (Ann.) [%] | 18.97 | 33.65 |
| Sharpe Ratio | 0.98 | 0.53 |
| Sortino Ratio | 1.89 | 0.93 |
| Calmar Ratio | 1.38 | 0.36 |
| Max. Drawdown [%] | -13.43 | -49.38 |
| Avg. Drawdown [%] | -3.38 | -5.11 |
| Max. Drawdown Duration | 328 days | 422 days |
| Avg. Drawdown Duration | 44 days | 40 days |
| # Trades | 30 | 1 |
| Win Rate [%] | 80.0 | 100.0 |
| Best Trade [%] | 27.34 | 390.23 |
| Worst Trade [%] | -5.63 | 390.23 |
| Avg. Trade [%] | 5.65 | 390.23 |
| Max. Trade Duration | 94 days | 3520 days |
| Avg. Trade Duration | 50 days | 3520 days |
| Profit Factor | 10.58 | nan |
| Expectancy [%] | 5.89 | 390.23 |
| SQN | 4.34 | nan |
Risk Management
Risk assessment is crucial in trading, with this strategy exhibiting an annual volatility of 18.97%. The Sharpe Ratio, a measure of risk-adjusted return, stands at 0.979, suggesting a favorable balance between risk and reward. The maximum drawdown, a critical metric for understanding potential losses, was limited to -13.43%, with an average drawdown of -3.38% and durations averaging 44 days.

Trade Analysis
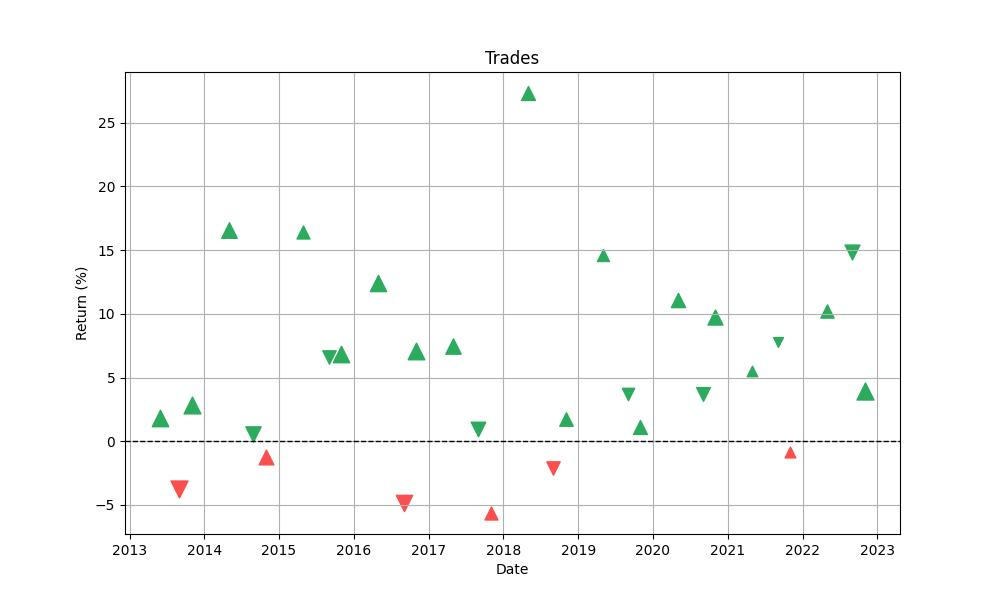
Throughout the backtesting period, the strategy engaged in 30 trades with an impressive 80% win rate. The best trade boasted a 27.34% return, while the worst saw a decline of -5.63%. Trades averaged a 5.65% return and lasted about 50 days on average, contributing to a high profit factor of 10.58 and an expectancy of 5.89%.
Conclusion
This in-depth analysis reveals that a well-structured monthly seasonality trading strategy can potentially offer superior returns compared to a traditional buy-and-hold approach. By capitalizing on the predictable patterns within specific months, investors can both enhance returns and manage risk more effectively. As always, it’s important to remember that past performance does not guarantee future results, and investors should conduct their due diligence before engaging in any trading strategy.

“Make the invisible visible. My goal is to shine a light on the subtle seasonal signals in the stock market, providing investors with the insight needed to make informed decisions. By breaking down the complexities of seasonality, I strive to empower our audience with knowledge and foresight, turning data into action.”