


Introduction
In the ever-changing landscape of the stock market, understanding and capitalizing on the seasonality of equities can be a game-changer for investors looking to maximize their returns. The rhythm of the financial markets often dances to the tune of recurring temporal patterns. For those tuned into these patterns, a world of strategic trading unfolds—one that can potentially offer a significant edge over traditional investment approaches.
Imagine harnessing the historical ebb and flow of the stock market to enhance your investment strategy. This is precisely what a monthly seasonality trading strategy aims to achieve, particularly when applied to the SPDR Dow Jones Industrial Average ETF Trust, known by its ticker symbol DIA. With a strategy that delves deep into nearly two decades of market data, investors have the opportunity to optimize their market positions by taking advantage of the times when stocks have historically performed better.
The concept is straightforward but intriguing: by establishing long positions in specific months when stocks have historically shown strength, and refraining from short positions even during weaker periods, the strategy embodies a unique blend of bullish optimism and calculated restraint. It’s not about being in the market all the time but about being in the market at the right time.
Our comprehensive analysis unpacks the intricacies of this trading approach, revealing how selective market engagement based on historical performance can lead to impressive results. This introduction sets the stage for a deep dive into a strategy that has not only stood the test of time but also challenges the conventional wisdom of constant market exposure. So, buckle up as we embark on this fascinating journey through the seasonality of the stock market and the trading strategies that thrive within it.
Company Overview
SPDR Dow Jones Industrial Average ETF Trust (DIA) is an exchange-traded fund (ETF) that tracks the performance of the Dow Jones Industrial Average (DJIA), a renowned stock market index composed of 30 prominent publicly traded companies in the United States. Managed by State Street Global Advisors, DIA offers investors an opportunity to diversify their portfolios by investing in a single fund that mirrors the overall performance of these leading industrial giants.
Strategy Overview
Investors often seek to optimize their market positions by leveraging historical patterns, and the monthly seasonality trading strategy is one such approach that has caught the attention of many. This strategy, applied to the SPDR Dow Jones Industrial Average ETF Trust (Symbol: DIA), hinges on the premise that certain months tend to yield better stock performance than others.
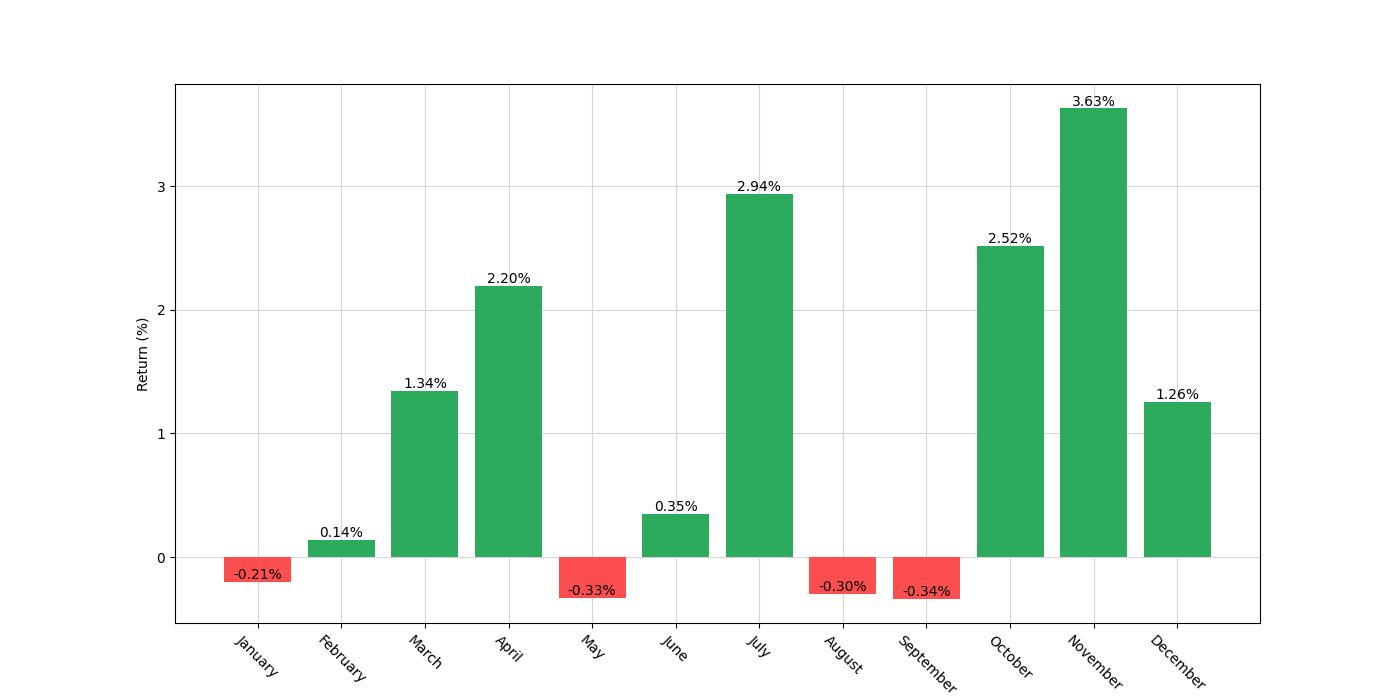
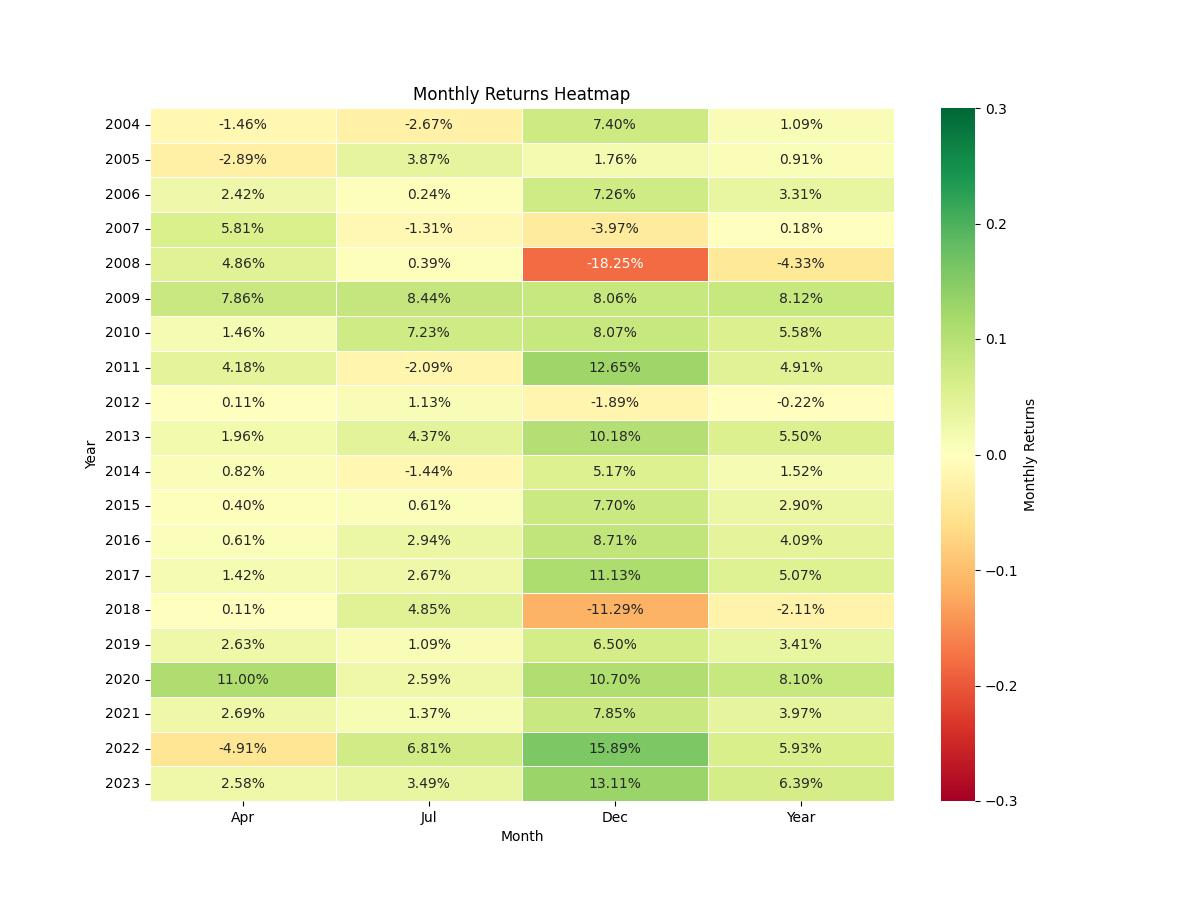
The backtest of this strategy spans nearly two decades, starting from January 2, 2004, and stretching all the way to December 29, 2023. A period of 7301 days, or exactly 20 years, encapsulates numerous market cycles, providing a robust dataset for analysis. The strategy’s rules are simple yet distinct: it dictates establishing a long position exclusively in the months of April, July, October, November, and December. Notably, there are no short positions taken at any point during the year, which underscores a bullish bias for these selected periods.
During the backtest period, the strategy’s market exposure was approximately 42.93% of the time, which is slightly less than half the duration. This reduced market exposure is a consequence of being selectively invested only during the months anticipated to be favorable based on historical patterns. Such an approach inherently suggests a lower risk profile, as it avoids market participation during times deemed to be less profitable or more volatile, based on the seasonal tendencies observed in the past.
Executing this strategy would have required an initial capital of $10,000. This initial investment is the baseline to evaluate the strategy’s performance, allowing for a clear comparison of returns in relation to the initial stake. It is important to note that the backtesting results do not factor in commissions or slippage, which in real-world scenarios can affect the actual performance. However, the omission of these variables ensures a clean analysis of the strategy’s raw efficacy, assuming ideal trading conditions.
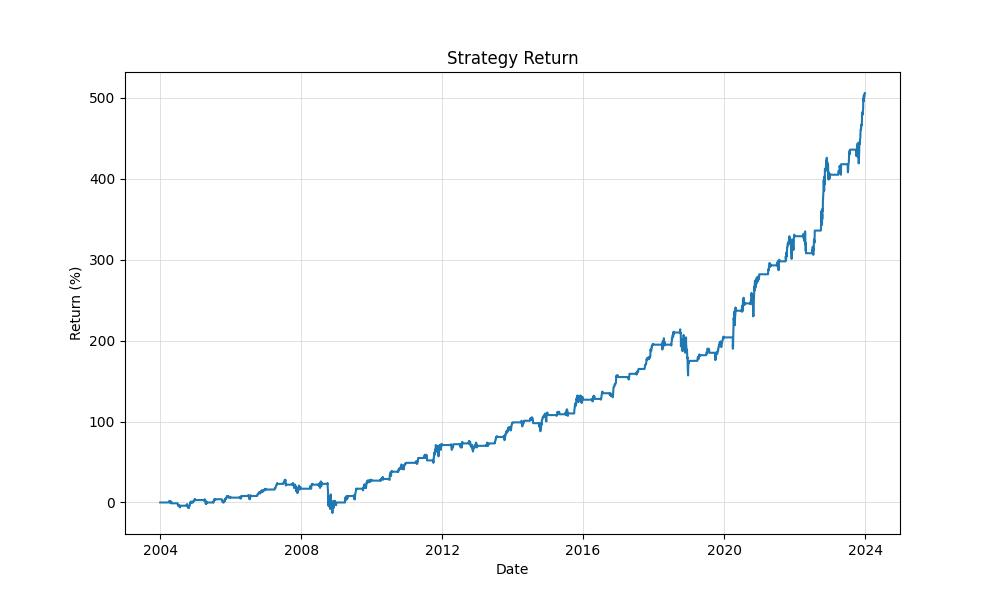
The strategy’s effectiveness is evident in its impressive performance. From the initial $10,000, the strategy’s execution would have seen the equity grow to a final amount of $60,556.69. This represents a substantial return of over 505%, a noteworthy achievement when compared to the traditional buy-and-hold strategy, which would have returned approximately 469% over the same period. Although the buy-and-hold strategy has nearly constant market exposure, the monthly seasonality strategy managed to outperform it, further highlighting the potential value of seasonal trading patterns.
Moreover, the annualized return of the strategy stands at 9.44%, a solid performance, especially when considering the less than half-year exposure time. This annualized figure provides a more granular view of the strategy’s performance, normalizing returns over a standard year, which is beneficial for comparison with other investment strategies or benchmarks.
Key Performance Indicators
Investors often gauge the success of a trading strategy by examining its key performance indicators (KPIs), which provide a snapshot of the strategy’s profitability and efficiency over time. When looking at the monthly seasonality trading strategy applied to the SPDR Dow Jones Industrial Average ETF Trust, also known as the DIA, we notice some illuminating metrics that are worth unpacking for our savvy investors.
The strategy concluded with an impressive Equity Final of $60,556.69, which indicates the total value of the portfolio at the end of the testing period. This is a noteworthy increase from the initial capital of $10,000, showcasing the potential of seasonal trends in generating significant returns. Furthermore, this figure also represents the Equity Peak, meaning that the strategy’s final equity was the highest value reached throughout the trading period.
Speaking of returns, the strategy yielded a Return of 505.57%, which eclipses the Buy & Hold Return of 468.82% over the same time frame. This suggests that actively managing trades based on the seasonality strategy outperformed a passive investment approach in the DIA. To put it into perspective, for every dollar invested, the seasonality strategy returned over five dollars, while the buy and hold approach returned approximately four and a half dollars.
When we annualize the returns, the strategy boasts a Return (Ann.) of 9.44%, which beats the annualized return from the buy and hold strategy of 9.03%. This annualized figure gives investors a clearer picture of what they could expect in terms of yearly performance, smoothing out the fluctuations and providing a standardized comparison point.
What these numbers suggest is that by carefully selecting the months to go long, based on historical performance, this trading strategy has been able to capitalize on recurring seasonal trends that have historically affected the performance of the stock market. By doing so, it has demonstrated the ability to outpace the broader market’s growth when simply held over the same period.
It’s important to note that these results are based on backtesting over a period from January 2, 2004, to December 29, 2023. While past performance is no guarantee of future results, the consistent application of the strategy over nearly two decades offers a robust dataset for evaluating its effectiveness. During this time, with an Exposure Time of roughly 42.94%, the strategy was active less than half of the time, which could be an attractive aspect for investors looking for a less time-intensive approach to the market.
These KPIs provide a compelling insight into the strategy’s performance. They underscore the potential benefits of incorporating seasonality into trading decisions, with the caveat that investors should always consider the inherent risks and their personal investment goals before adopting any new strategy.
Risk Management
Navigating the stock market’s fluctuations requires not just a keen eye for opportunity but also a robust risk management strategy. This is where understanding the intricacies of seasonal trading patterns comes into play. By delving into the seasonality of the SPDR Dow Jones Industrial Average ETF Trust (DIA), we’ve backtested a strategy that targets specific months for long positions, capitalizing on historical trends without applying short positions.
The annual volatility of this strategy sits at approximately 12.91%, which is notably lower than the broader market’s volatility of nearly 19.86% for a similar period under a buy-and-hold approach. This reduced volatility is indicative of the strategy’s more targeted exposure to market risks, as it is only active during selected months, which amounts to an exposure time of roughly 42.94%. Essentially, by being selective about when to enter the market, this strategy avoids some of the more turbulent periods that can erode investment value.
The Sharpe Ratio, a measure of risk-adjusted return, for the monthly seasonality strategy is 0.73. Although this figure suggests that the strategy provides a decent return per unit of risk taken, it’s important for investors to remember that a higher Sharpe Ratio—typically above 1—is generally considered excellent. Nevertheless, the strategy outperforms the buy-and-hold approach, which has a Sharpe Ratio of 0.45, demonstrating that the seasonality strategy is more efficient in terms of the excess return it generates over the risk-free rate.
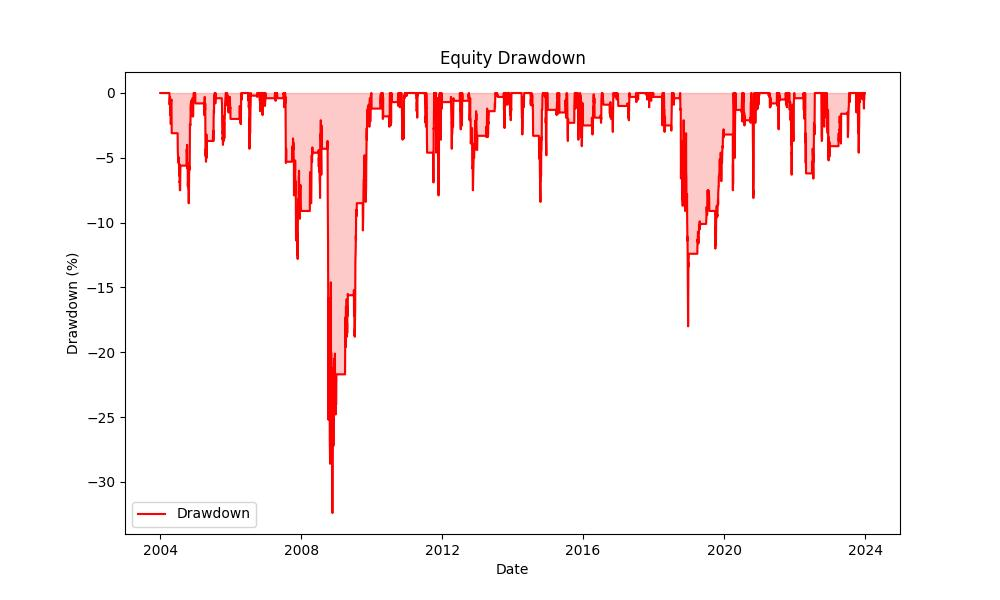
When it comes to drawdowns, which are peak-to-trough declines in the value of an investment, the strategy experienced a maximum drawdown of 32.42%. While this might appear significant, it’s relatively lower compared to the 51.83% maximum drawdown faced by a passive buy-and-hold investor during the same period. This is crucial because a lower maximum drawdown suggests a more tolerable decline from which the investment can recover. The average drawdown, a reflection of the typical decline from a peak, also follows this trend, with the strategy averaging a drawdown of 1.71% versus the buy-and-hold’s average of 2.05%.
Moreover, the duration of these drawdowns is equally important. The longest period the strategy spent in a drawdown was 893 days, while the average time spent recovering from drawdowns was 37 days. This compares to the buy-and-hold strategy, which could leave an investor waiting up to 1563 days to recover from the worst drawdown. Shorter drawdown durations in the seasonality strategy mean that investors potentially spend less time with their capital depreciated, allowing for a quicker rebound and compounding.
In essence, this monthly seasonality strategy demonstrates a balance between seeking returns and managing risk. While no strategy is without the potential for loss, the backtested results suggest that by taking a calculated approach to seasonal trends, investors can potentially mitigate some of the market’s inherent risks. It’s a reminder that in investing, as in all seasons of life, timing can be everything.
Trade Analysis
Delving into the mechanics of the trading strategy in question, we uncover a tapestry of trade-related statistics that offer investors a clearer picture of performance. This strategy, centered around the SPDR Dow Jones Industrial Average ETF Trust (DIA), has undergone a rigorous backtest over an extensive period, from January 2, 2004, to December 29, 2023.
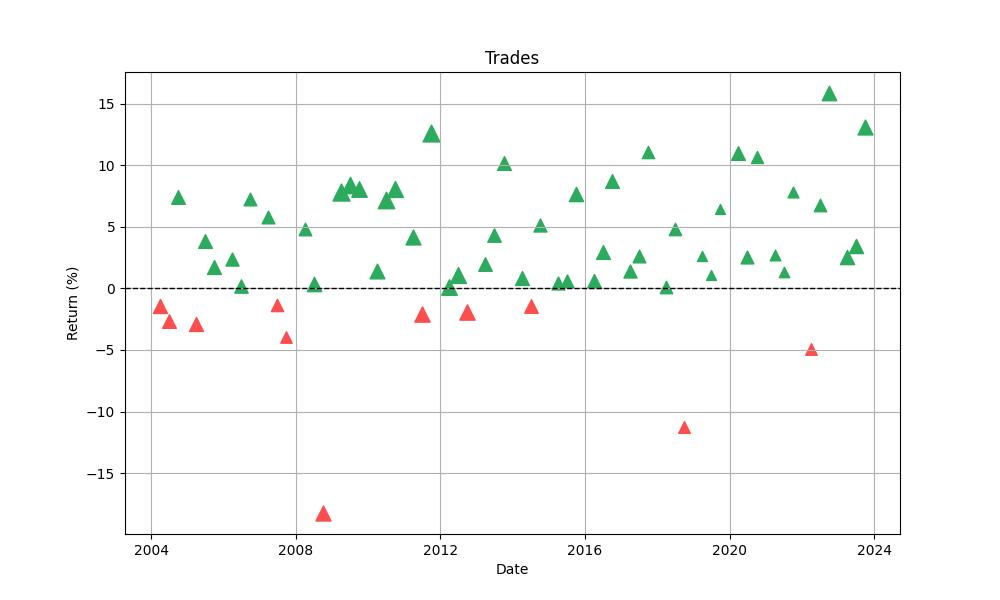
The strategy’s backbone comprises a total of 60 trades, a number that may seem modest over nearly two decades but is a reflection of its monthly seasonality focus. Investors might find assurance in the fact that the strategy has a stellar win rate of 81.67%. This high percentage indicates that more than eight out of ten trades executed according to the strategy’s rules ended in profit, a testament to the robustness of the seasonal approach.
The most profitable trade within this period yielded an impressive 15.89% return, showcasing the strategy’s potential to capitalize on strong seasonal trends. Conversely, the strategy’s resilience was tested with its worst trade, which resulted in an 18.25% loss, reminding investors that even strategies with strong historical performance are not immune to market volatility and unexpected downturns.
These individual trade outcomes combine to form an average trade return of 3.06%, which may appear moderate but is significant when compounded over multiple trades and time. With an average trade duration of 51 days, this strategy doesn’t require investors to lock in capital for extended periods, allowing for flexibility and the opportunity to reassess positions frequently.
The Profit Factor for this strategy stands at an impressive 4.698, indicating that the total gross profits are nearly 4.7 times the total gross losses. This ratio is particularly important for investors as it underscores the strategy’s efficiency in capitalizing on winning trades while minimizing the impact of the losing ones.
Expectancy, which measures the average amount investors can expect to win or lose per trade, is positive at 3.22%. This is another encouraging sign, suggesting that on average, each trade contributes positively to the overall equity growth.
Conclusion
In sum, our examination of the monthly seasonality trading strategy applied to the DIA ETF reveals a compelling case for seasonal trading patterns as a potentially lucrative approach to the stock market. The strategy’s significant outperformance over the traditional buy-and-hold strategy, as evidenced by a 505.57% return versus 468.82%, alongside a superior annualized return of 9.44%, underscores the value of strategic, time-focused market entry and exit points. The robustness of this strategy is further bolstered by its high win rate, substantial equity growth, and a favorable risk profile characterized by reduced volatility and drawdowns compared to a passive investment strategy.
However, it’s imperative to remember that no investment strategy is foolproof, and past performance is not indicative of future results. Seasonal trends are just one piece of the complex puzzle that is the financial market. Individual investors should consider their risk tolerance, investment goals, and the broader economic context before adopting any trading strategy. It is also advisable to take into account transaction costs and potential slippage in real-world trading situations that could affect profitability.
The monthly seasonality strategy presents an attractive framework for those willing to adopt a disciplined and time-specific approach to investing. It capitalizes on historical patterns to reduce risk exposure and aims to maximize returns by engaging the market at historically opportune times. As we’ve seen in the analysis, this method has demonstrated resilience and profitability over a substantial period, offering a structured yet flexible investment strategy that could augment an investor’s portfolio.
In conclusion, the seasonality of the stock market offers fertile ground for investors who are prepared to harness recurring temporal trends. With the right blend of historical insight and disciplined execution, seasonal trading strategies like the one we’ve outlined could be a valuable addition to an investor’s toolkit. As always, investors should proceed with caution, remain informed, and ensure any strategy aligns with their overall financial plan.

“Make the invisible visible. My goal is to shine a light on the subtle seasonal signals in the stock market, providing investors with the insight needed to make informed decisions. By breaking down the complexities of seasonality, I strive to empower our audience with knowledge and foresight, turning data into action.”