


Introduction
As the leaves change colors and the air turns crisp, many of us revel in the predictability of the changing seasons. But did you know that the stock market, with its seemingly chaotic ebbs and flows, also exhibits its own patterns of seasonality? For investors who can decode these temporal signs, the rewards can be as bountiful as the harvest season.
Welcome to the world of seasonal trading strategies, where understanding the cyclical trends can offer a significant edge. The Southern Company, an energy titan in the tapestry of the American stock market, serves as a case study for a strategy that could potentially help investors reap the benefits of the market’s seasonal tendencies.
This blog post will delve into the enigmatic rhythm of the stock market’s seasonality and the trading strategies that aim to harness it. We’ll explore the historical data, the strategic moves at specific times of the year, and the backtested results that suggest such a focused approach might lead to lucrative outcomes.
Join us as we navigate the intricacies of the stock market’s seasons. Whether you’re a seasoned investor or just starting out, understanding the seasonality of stocks like The Southern Company could be the windfall you’ve been looking for in your investment journey. Let the exploration begin!
Company Overview
Southern Company, a premier energy provider headquartered in Atlanta, Georgia, is renowned for its commitment to clean, safe, reliable, and affordable energy solutions. Catering to 9 million customers across four southeastern states, the company’s operations span power generation, transmission, and distribution. Its diverse portfolio includes nuclear, coal, natural gas, and renewable energy sources, positioning it as a leader in the transition to a sustainable energy future. Southern Company’s robust transmission infrastructure ensures efficient power delivery, while its commitment to customer service and technological innovation drives its competitive edge. With a focus on environmental stewardship and community engagement, the company remains a cornerstone of the region’s economic and social fabric.
Strategy Overview
In the intricate dance of the stock market, timing can be as critical as the stocks you choose. The Southern Company (SO), a leading energy company in the United States, has been observed through the lens of a monthly seasonality trading strategy, an approach that is designed to capitalize on predictable patterns during certain times of the year.
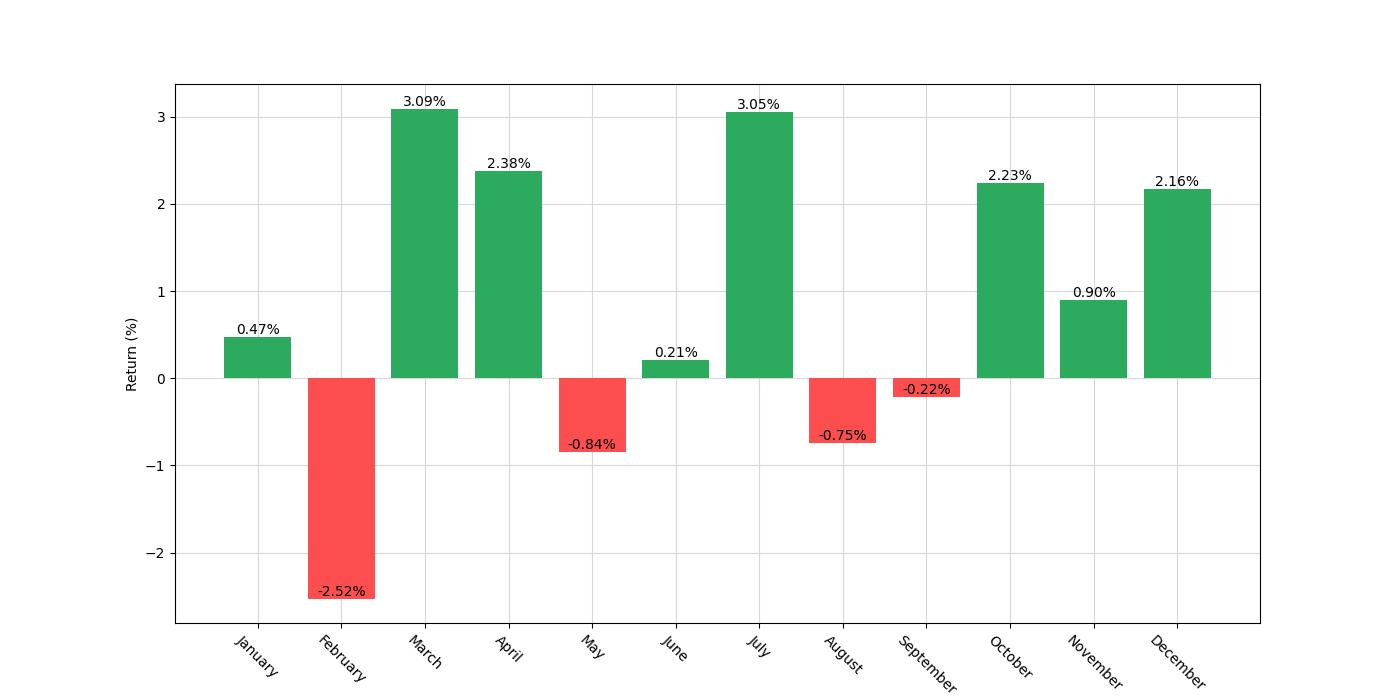
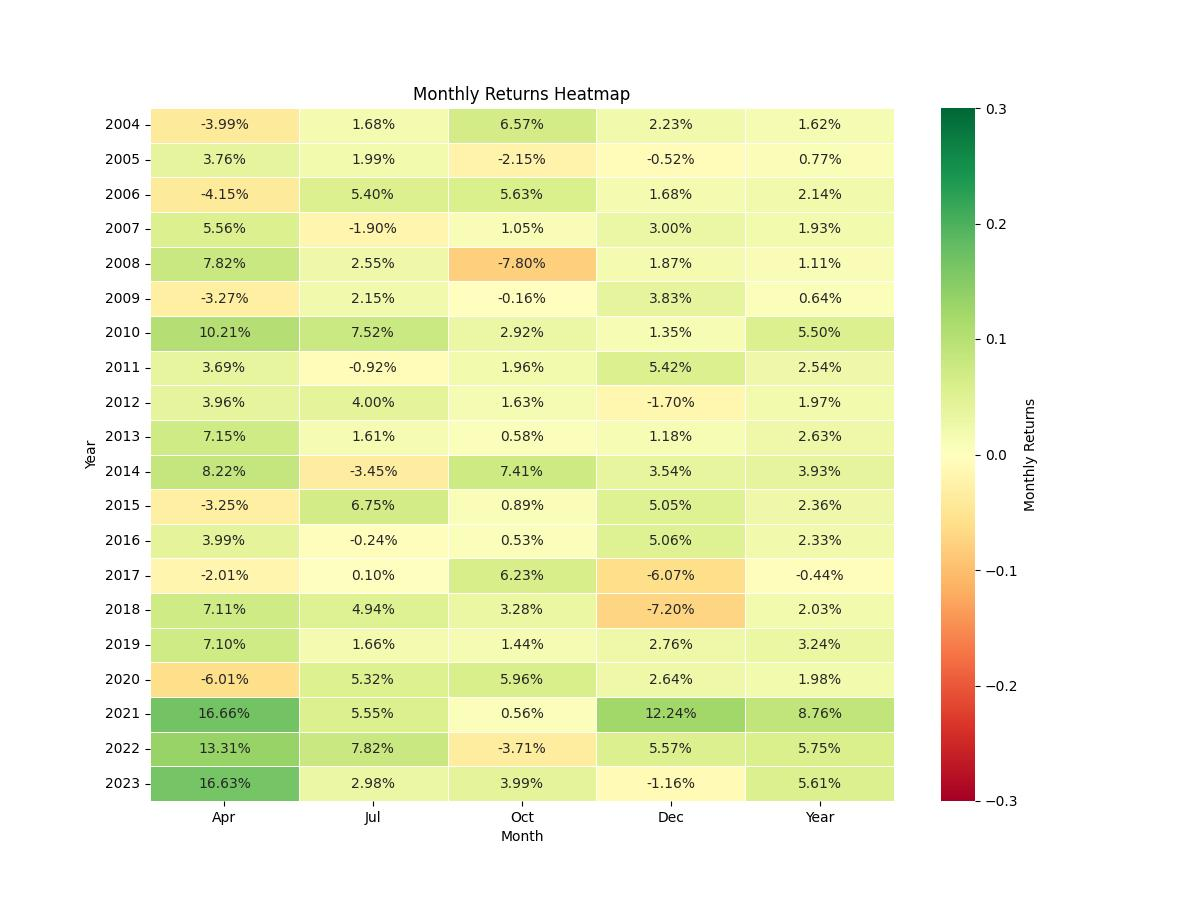
This particular strategy operates on a simple premise: it initiates a long position on SO shares at the close of the last trading day in February, April, June, September, and November, and then exits that position at the close of the last trading day in March, April, July, October, and December, respectively. This pattern is based on historical data suggesting that these months offer a favorable environment for the company’s stock performance.
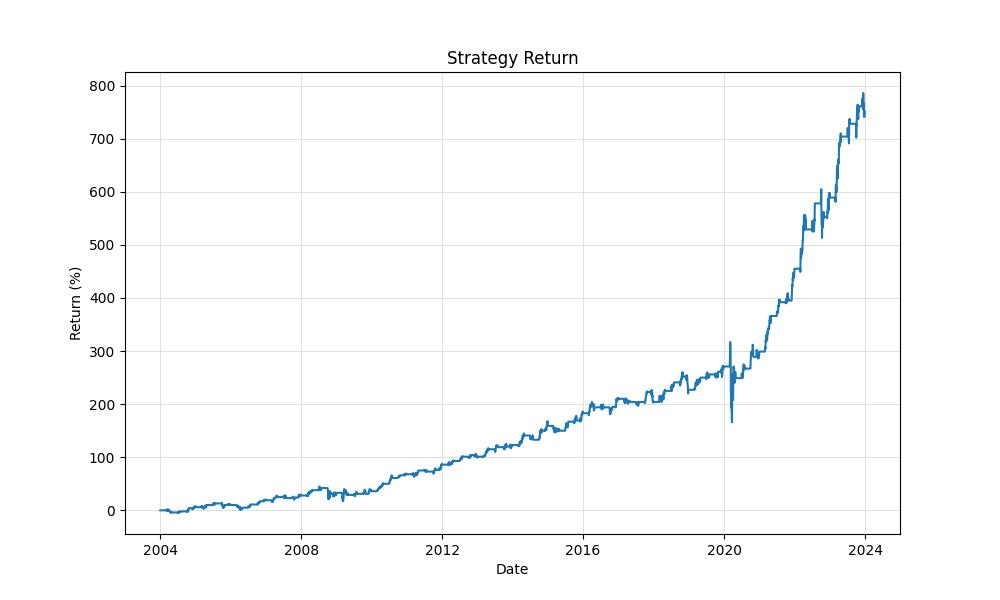
The backtesting of this strategy spans nearly two decades, from January 2, 2004, to December 29, 2023, providing a robust duration of 7,301 days, or about 20 years, to evaluate its effectiveness. During this period, the strategy is not always engaged in the market; it is only active for approximately 44% of the time. This focused approach allows the investor to be exposed to potential gains during identified seasonal peaks while reducing the time their capital is at risk.
The initial capital allocated for this strategy was $10,000. It’s important to note that the backtest results are pure in the sense that they do not account for transaction costs such as commissions, which can erode profitability, nor do they include slippage, which can occur when there is a difference between the expected price of a trade and the price at which the trade is executed.
The outcomes of this strategic approach are compelling. The equity of the portfolio at the end of the backtesting period stands at $85,102.46, while the peak equity reached during the testing period was slightly higher at $88,641.50. When we compare this to the strategy’s starting capital, we see a return of 751.02%, significantly outperforming the buy-and-hold return of 480.52%. On an annualized basis, this strategy has provided a return of 11.32%, a robust figure that is indicative of the strategy’s potential to enhance an investor’s portfolio.
It’s worth mentioning that the strategy’s performance should be viewed within the context of the overall market conditions and the specific characteristics of the Southern Company’s stock. While the past performance is no guarantee of future results, the historical data presents a compelling argument for the strategy’s effectiveness over the considered period. As with any investment strategy, it is essential for investors to conduct their own due diligence and consider their risk tolerance and investment objectives before implementing such a strategy.
Key Performance Indicators
When exploring the intricacies of stock market investing, one often stumbles upon the concept of seasonality. This is the idea that certain times of the year can predictably affect the performance of stocks. A compelling illustration of this principle can be found in the backtest results of a monthly seasonality trading strategy applied to The Southern Company, a leading utility firm.
The strategy in question zeroes in on the months of March, April, July, October, and December, during which it advocates taking a long position on The Southern Company’s stock. The backtest, which spans a remarkable 19 years from January 2004 to December 2023, reveals some intriguing insights into the potential effectiveness of this seasonal approach.
Initially fueled by a hypothetical capital of $10,000, the strategy’s end equity comes to an impressive $85,102.46. When you juxtapose this figure with the equity peak of $88,641.50, it becomes clear that the strategy not only increases capital but does so with a noteworthy upward potential.
Investors often gauge the success of an investment strategy by its total return. Here, the strategy boasts a return of 751.02%, which is a substantial margin over the buy and hold return of 480.52% for the same period. This stark difference underlines the value of a well-thought-out seasonal trading approach compared to a passive investment strategy.
However, it is the annualized return that truly captures an investor’s attention. A yearly return of 11.32% from the seasonality strategy comfortably surpasses the 9.20% return of a simple buy and hold strategy. This annualized figure is especially significant as it demonstrates the strategy’s ability to compound wealth over time, a crucial aspect for long-term investors.
But what does this mean for the average retail investor? Simply put, the backtest results suggest that by following this seasonal trading strategy, investors could potentially increase their chances of above-average returns compared to a passive investment strategy. The allure of outperforming the market, combined with the tangible results presented, may indeed make this approach an attractive proposition for those looking to enhance their investment portfolio’s performance through the understanding of market seasonality.
Risk Management
As investors, understanding and mitigating risk is paramount in our trading endeavors. The Southern Company’s seasonality trading strategy offers a nuanced perspective on risk management, as evidenced by the backtesting results.
The annualized volatility of this strategy stands at 16.14%, which is a measure of the degree to which the investment’s returns vary over time. This figure is noteworthy because it reflects the consistency of the strategy’s performance. When compared to the buy and hold approach, which exhibits a higher annualized volatility of 21.19%, our monthly seasonality trading strategy demonstrates a more stable return pattern, which can be reassuring for investors who prefer less turbulent investment experiences.
The Sharpe Ratio, a tool used to understand the return of an investment compared to its risk, is 0.701 for our strategy. This is an indicator of how well the excess return of the strategy compensates for the additional volatility. In essence, the higher the Sharpe Ratio, the better the risk-adjusted performance. With a Sharpe Ratio that is significantly higher than that of the buy and hold strategy, which is at 0.434, investors can be more confident in the soundness of their investment choice.
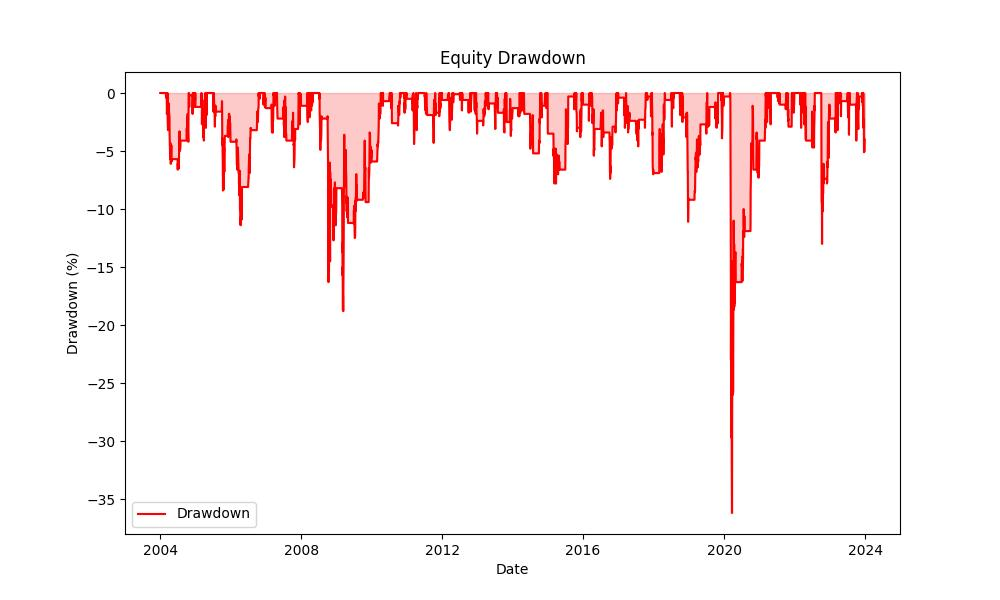
When we delve into drawdowns, which are peak-to-trough declines in account equity, the strategy’s maximum drawdown is recorded at -36.20%. Drawdowns are critical as they give us an insight into the potential losses that might occur during trading. This maximum drawdown lasted for 636 days, indicating a period of significant decline before a rebound. However, the average drawdown is much lower, at -1.98%, with an average duration of 36 days. This suggests that while the strategy can experience substantial dips, they are not the norm and recoveries tend to happen relatively quickly.
In comparison, the buy and hold approach saw a maximum drawdown of -38.43% and an average drawdown of -2.79%, with longer durations for both the maximum and average drawdowns. This demonstrates that our trading strategy not only has slightly less severe drawdowns but also recovers from them more swiftly than a simple buy and hold approach.
The backtesting results show that our strategy’s risk management profile is robust, with lower volatility and quicker recovery from drawdowns than a traditional buy and hold strategy. Understanding these risk factors helps in making an informed decision about whether this trading approach aligns with your individual risk tolerance and investment goals.
Trade Analysis
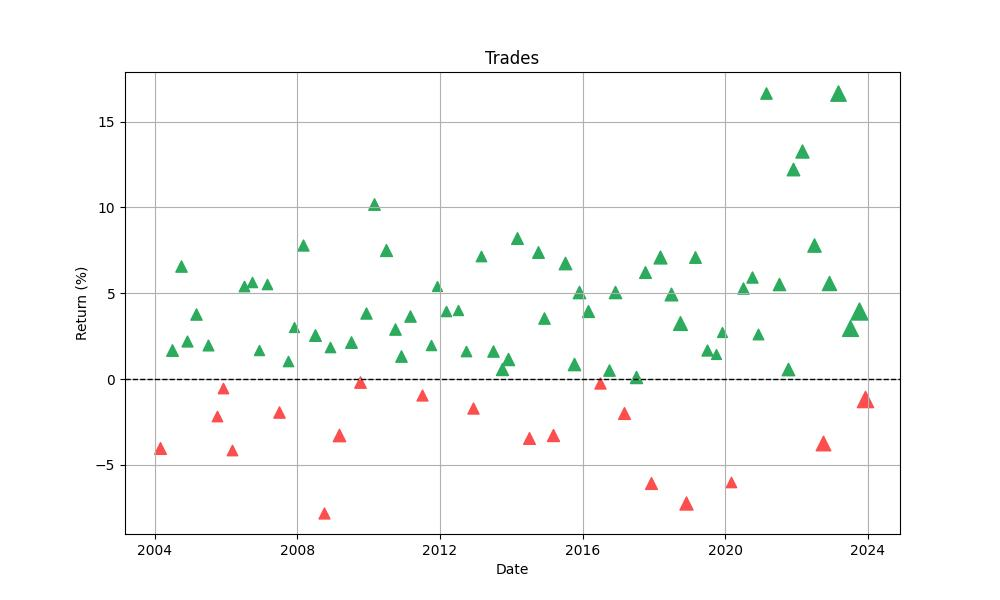
Diving into the heart of our monthly seasonality trading strategy for The Southern Company, let’s unpack the trade dynamics and what they signal to the informed investor. With a total of 80 trades executed throughout the backtesting period, one is immediately struck by the robust win rate of 76.25%. This figure alone is an encouraging indicator of the strategy’s efficacy, suggesting a high level of precision in capitalizing on the company’s seasonal trends.
Delving deeper, the best trade yielded an impressive 16.66% return, a testament to the potential upside of timing the market in alignment with historical patterns. On the flip side, the strategy was not without its challenges—the worst trade resulted in a 7.80% loss, a stark reminder of the inherent risks in stock market investment. These outliers, however, are part of a broader narrative where the average trade return stood at a healthy 2.71%, indicating that, more often than not, the strategy tended to generate positive outcomes.
The duration of trades also provides valuable insights. The longest trade was active for 63 days, while on average, trades were held for 39 days. This relatively short average duration underscores the strategy’s focus on capitalizing on short-term seasonal movements rather than long-term holding.
Investors are often keen to understand the efficiency of a strategy—essentially, for every dollar risked, what was the return? This is where the profit factor comes into play. For this strategy, a profit factor of 4.78 is particularly noteworthy. It implies that the returns were nearly 4.8 times the size of the losses, a ratio that highlights the strategy’s effectiveness in maximizing gains over losses.
Moreover, expectancy sheds light on what one might expect from an average trade. An expectancy of 2.82% suggests that, on average, each trade contributed positively to the overall strategy’s growth, reinforcing the notion that the strategy has a sound statistical edge.
Finally, it’s important to discuss the System Quality Number (SQN), which is a measure of the strategy’s reliability and soundness. An SQN of 4.05 is considered excellent. It reflects not only the strategy’s strong average returns but also the consistency of those returns, providing investors with a degree of confidence in the strategy’s robustness over the backtesting period.
In essence, the trade analysis of our seasonal strategy for The Southern Company paints a picture of a strategy that has managed to navigate the ebb and flow of the market with a remarkable success rate, a favorable balance between reward and risk, and a consistency that promises reliability for those considering its application in their investment endeavors.
Conclusion
To distill the insights from our comprehensive exploration of the seasonal trading strategy applied to The Southern Company, it’s clear that the approach has yielded impressive results. The strategy has consistently outperformed a passive buy-and-hold approach, demonstrating the value of strategic timing in stock market investments. With an annualized return of 11.32% and a win rate of 76.25%, the strategy stands as a testament to the efficacy of leveraging seasonal patterns in the market.
The risk-adjusted measures further fortify the argument for this trading strategy. The lower volatility and superior Sharpe Ratio compared to the traditional buy-and-hold strategy signify a smoother investment journey with potentially fewer bumps along the way. The strategy’s ability to recover from drawdowns swiftly speaks to its resilience and the effectiveness of its risk management protocols.
The trade analysis reveals that, while no strategy is immune to losses, the high profit factor and positive expectancy indicate a robust edge in the market. These metrics underscore a disciplined approach that has, more often than not, led to profitable outcomes. The excellent System Quality Number reinforces the reliability of the strategy over the course of the backtesting period.
In conclusion, for investors intrigued by the potential of a seasonality-based trading strategy, the evidence provided through extensive backtesting suggests that this approach may offer a compelling alternative to more passive strategies. By understanding and utilizing the rhythmic patterns of the stock market, as exemplified by The Southern Company, investors could potentially enhance their portfolios with prudent and informed timing decisions that align with historical market seasonality.
However, it is essential to remember that past performance does not guarantee future results, and investors should carefully consider their own risk tolerance and investment objectives. Proper due diligence and a continuous appraisal of market conditions will remain crucial components of any successful investment strategy. With these considerations in mind, the seasonal trading strategy we’ve dissected offers a fascinating opportunity for those looking to navigate the temporal complexities of the stock market with an informed, strategic edge.

“Make the invisible visible. My goal is to shine a light on the subtle seasonal signals in the stock market, providing investors with the insight needed to make informed decisions. By breaking down the complexities of seasonality, I strive to empower our audience with knowledge and foresight, turning data into action.”