


Investors often seek to understand the ebb and flow of the stock market. Seasonality strategies can provide a blueprint for those looking to capitalize on predictable patterns within the market’s seemingly unpredictable nature. Today, we dive deep into the monthly seasonality trading strategy applied to CDW, uncovering the potential benefits of timing the market with precision.
Company Overview
CDW is a leading multi-brand technology solutions provider to business, government, education, and healthcare customers. The company offers a broad array of hardware, software, and integrated IT solutions, including cloud and data center services, cybersecurity, and digital transformation. CDW’s tailored services and solutions are designed to streamline operations and drive value across various organizational functions.
Strategy Overview
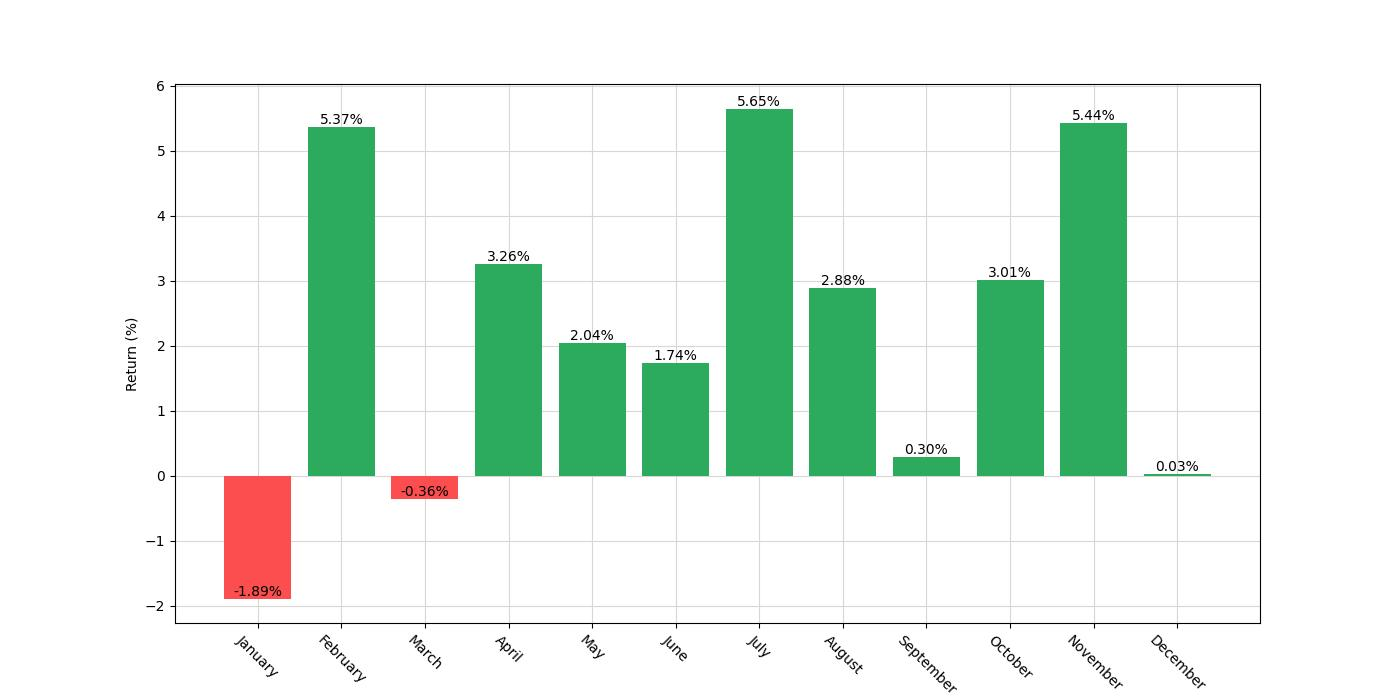
The strategy in question involves entering long positions in CDW during February, April, May, June, July, August, October, and November, and taking a short position in January. The analysis spans from June 27, 2013, to December 30, 2022, encompassing 3473 days of market activity. During this period, the strategy maintained a market exposure of approximately 67.9%.
Key Performance Indicators
Backtesting the strategy revealed an impressive final equity of $134,105.83, peaking at $134,531.72. This translates to a return of 1241.06%, outperforming the buy and hold return of 969.12%. The annualized return stood at 31.40%, indicating a robust performance over the testing period.

| Strategy | Buy and Hold | |
|---|---|---|
| Start Date | 2013-06-27 | 2013-06-27 |
| End Date | 2022-12-30 | 2022-12-30 |
| Duration | 3473 days | 3473 days |
| Exposure Time [%] | 67.9 | 99.92 |
| Equity Final [$] | 134105.83 | 106205.25 |
| Equity Peak [$] | 134531.72 | 121446.76 |
| Return [%] | 1241.06 | 962.05 |
| Return (Ann.) [%] | 31.4 | 28.21 |
| Volatility (Ann.) [%] | 29.81 | 37.34 |
| Sharpe Ratio | 1.05 | 0.76 |
| Sortino Ratio | 2.18 | 1.45 |
| Calmar Ratio | 1.3 | 0.63 |
| Max. Drawdown [%] | -24.16 | -44.83 |
| Avg. Drawdown [%] | -3.56 | -4.28 |
| Max. Drawdown Duration | 363 days | 360 days |
| Avg. Drawdown Duration | 32 days | 29 days |
| # Trades | 29 | 1 |
| Win Rate [%] | 82.76 | 100.0 |
| Best Trade [%] | 25.16 | 962.32 |
| Worst Trade [%] | -12.19 | 962.32 |
| Avg. Trade [%] | 9.37 | 962.32 |
| Max. Trade Duration | 155 days | 3471 days |
| Avg. Trade Duration | 80 days | 3471 days |
| Profit Factor | 10.77 | nan |
| Expectancy [%] | 9.79 | 962.32 |
| SQN | 3.07 | nan |
Risk Management
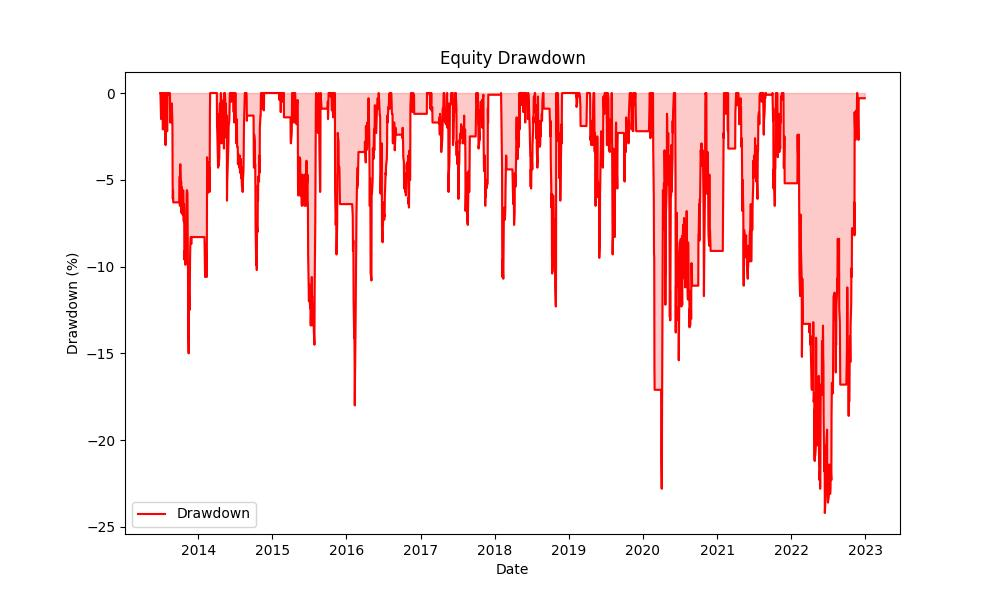
Risk assessment is essential in trading. The annualized volatility of 29.81% reflects the strategy’s fluctuation rate. The Sharpe Ratio at 1.05 suggests that the return compensates for the risk taken. The maximum drawdown was -24.16%, with an average drawdown of -3.56%, and the longest drawdown period lasted 363 days.
Trade Analysis
The strategy executed 29 trades with an 82.76% win rate. The best trade yielded a 25.16% return, while the worst saw a decline of -12.19%. The average trade return was 9.37%, with the longest trade duration being 155 days and the average at 80 days. The Profit Factor stood at a remarkable 10.77, with an expectancy of 9.79%.

Conclusion
Overall, the backtesting results demonstrate that a well-crafted monthly seasonality strategy can yield substantial returns while mitigating risk. Investors should consider such strategies as part of a diversified portfolio to enhance their market positioning and potential profitability.


“Make the invisible visible. My goal is to shine a light on the subtle seasonal signals in the stock market, providing investors with the insight needed to make informed decisions. By breaking down the complexities of seasonality, I strive to empower our audience with knowledge and foresight, turning data into action.”