


Introduction
As the leaves change color and the days grow shorter, so too can the tides of the stock market ebb and flow with the seasons. For investors, understanding these seasonal trends is more than an exercise in curiosity—it’s a potential key to unlocking patterns that could guide profitable trading decisions. Seasonality in the stock market isn’t about the weather; it’s about identifying regular patterns in stock performance that seem to repeat year after year, providing a possible edge to those who can skillfully navigate these temporal shifts.
In the intricate dance of supply and demand, various factors from tax considerations to holiday spending can influence investor behavior and stock performance. As an eloquent Content Writer, it is my passion and duty to unravel these complexities and offer insights into how one might leverage such patterns to their advantage. In the forthcoming sections, we will dissect a case study of The Carlyle Group Inc., a heavyweight in the investment sector, and scrutinize a specific seasonal trading strategy that has shown promise over a significant period.
Our journey will take us through the mechanics of a trading strategy tailored to the unique rhythm of The Carlyle Group’s stock, encompassing both its moments of predictable behavior during certain months and its overall performance over a well-defined backtesting period. The goal is not to predict the future but to understand the past, and in doing so, equip investors with the knowledge to make more informed decisions about when to buy and sell based on historical data.
As we peel back the layers of seasonal stock market strategies, we will ensure that every investor, whether seasoned or novice, can grasp the significance of these patterns and potentially use them to enhance their investment strategy. Let’s embark on this analytical journey, guided by data and driven by the quest to demystify the seasonal ebb and flow of the stock market.
Company Overview
CG The Carlyle Group Inc. is a global alternative asset manager with $369 billion of assets under management. Carlyle invests across four segments: Corporate Private Equity, Real Assets, Global Credit, and Investment Solutions. The firm’s target market includes corporations, governments, and individuals. Carlyle generates revenue through management fees, performance fees, incentive fees, and other income. Its value proposition lies in its expertise in private equity, real estate, infrastructure, and credit investments, as well as its global reach and long-term investment horizon. Carlyle’s operational model involves sourcing, evaluating, and managing investments, with a focus on value creation and risk management. The firm’s growth strategy centers around expanding its product offerings, diversifying its investor base, and entering new markets. The alternative asset management industry is characterized by intense competition, evolving regulations, and increasing demand for ESG-compliant investments. Carlyle’s strong track record, experienced management team, and commitment to ESG principles position it well to navigate these challenges and continue delivering value to its investors.
Strategy Overview
Investors often seek to capitalize on patterns and trends within the stock market to enhance their portfolio returns. One such approach is employing a trading strategy based on the seasonality of stocks, which can sometimes reveal consistent temporal patterns in their performance. In this analysis, we will explore a seasonal trading strategy applied to The Carlyle Group Inc. (Symbol: CG), a global investment firm specializing in private equity, real assets, and private credit.
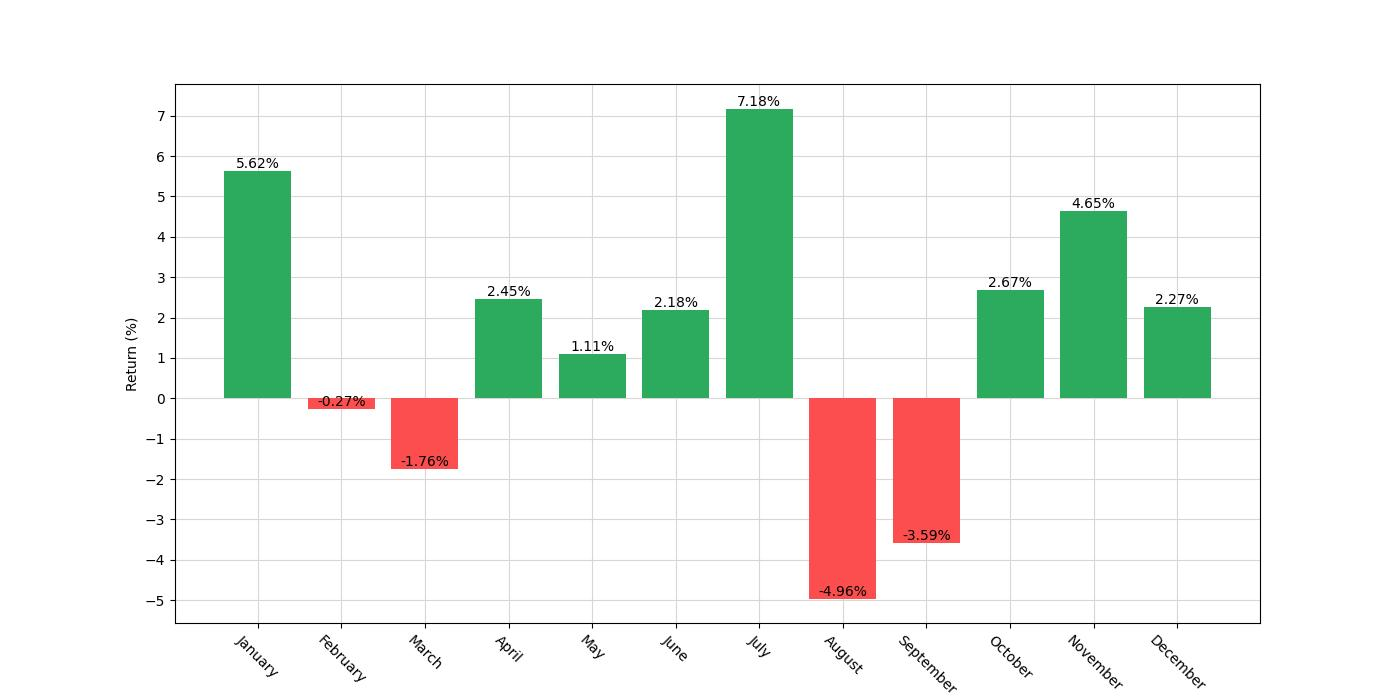
The trading strategy in question is a monthly seasonality strategy that involves taking a long position (buying the stock) during the months of June and July and entering a short position (betting that the stock will decline) for the months of August and September. The backtesting period for this strategy extends from the start date of May 3, 2012, to the end date of December 29, 2023, spanning a total of 4257 days.
Exposure time, which refers to the percentage of the total time period that the strategy is actively engaged in the market, stands at approximately 35.14%. This indicates that the strategy is not in the market at all times but is instead utilized strategically during specific months which are hypothesized to exhibit seasonal trends.
The initial capital allocated for this strategy was $10,000. It is important to note that the backtesting results do not account for commissions or slippage, which can impact real-world returns. Commissions are fees paid to brokers for executing trades, and slippage refers to the difference between the expected price of a trade and the price at which the trade is actually executed. Both factors can erode profits, particularly in high-frequency trading environments or when market liquidity is low.
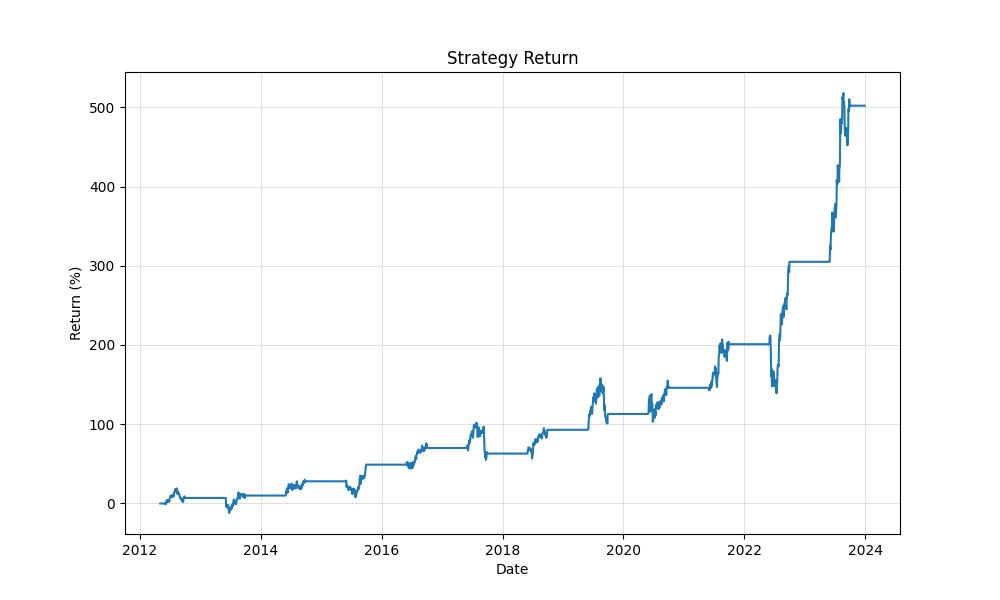
The results of the backtest reveal a compelling narrative. The final equity, representing the ending balance after executing the strategy over the backtesting period, stands at $60,233.99, while the peak equity reached during the period was $61,771.38. This suggests that not only has the strategy been profitable, but it has also managed to grow the initial investment by over 500%, with a total return of 502.34%. This is a significant outperformance compared to the buy-and-hold return of 260.34% for the same period, where the strategy of holding the stock without trading based on seasonality is considered.
Furthermore, the annualized return, which smooths out the returns over the period to provide an average yearly return, is 16.68%. This figure offers a more standardized comparison to other investment opportunities and underscores the efficacy of the seasonal trading approach for The Carlyle Group Inc. over the tested period.
The duration of the backtest and the consistency of the seasonal pattern across the years provide a robust framework for evaluating the efficacy of the strategy. Retail investors looking to harness seasonal trends could find such a strategic approach to be a valuable addition to their trading arsenal, offering a structured method for potentially enhancing returns while capitalizing on the temporal behavior of The Carlyle Group Inc.’s stock.
Key Performance Indicators
When evaluating the efficacy of any trading strategy, it’s critical to assess its performance over time. The backtest results for The Carlyle Group Inc. (CG) using a monthly seasonality trading strategy showcase some compelling figures that are worth delving into.
Looking at the final equity, the strategy concluded with an impressive $60,233.99 from an initial capital of $10,000, a testament to the strategy’s success over the backtested period. It is also notable that the equity peak reached during this period was $61,771.38, indicating that the strategy saw significant profitability before any downturns.
In terms of overall returns, the strategy yielded a 502.34% return, which is nearly double the buy-and-hold return of 260.34%. This stark contrast underscores the potential benefits of a more active trading approach based on seasonality for investors in The Carlyle Group Inc.
Annualized returns tell a similar story of success, with the strategy achieving an annual return of 16.68%. This annualized figure presents a more granular view of the strategy’s performance, allowing investors to compare it to other potential investment opportunities or benchmarks.
However, it’s not just the absolute return that matters, but also how it stacks up against a passive investment strategy. When we consider the buy-and-hold annualized return of 11.87%, we see that the seasonality strategy outperformed it by a notable margin, adding weight to its validity as an alternative investment approach.
Risk Management
Managing risk is a critical component of any trading strategy, and understanding the various risk metrics can help investors make more informed decisions. When looking at the backtested results of this particular monthly seasonality strategy for The Carlyle Group Inc. (CG), we delve into its risk profile to assess its suitability for a retail investor’s portfolio.
Firstly, the annualized volatility, which measures the extent of the strategy’s returns variation over a year, stands at 19.72%. This indicates a moderate level of risk when compared to the broader market. A lower volatility often points to a less risky portfolio, but it is essential to balance this with the returns generated.
The Sharpe ratio, a tool used to understand the return of an investment compared to its risk, is 0.845 for this strategy. This figure is quite telling; the strategy yields a respectable excess return per unit of risk. Generally, a Sharpe ratio greater than 1 is considered excellent, between 0.5 to 1 is good, and less than 0.5 is considered suboptimal. In this case, the strategy suggests a good risk-adjusted performance, although there might be room for improvement.
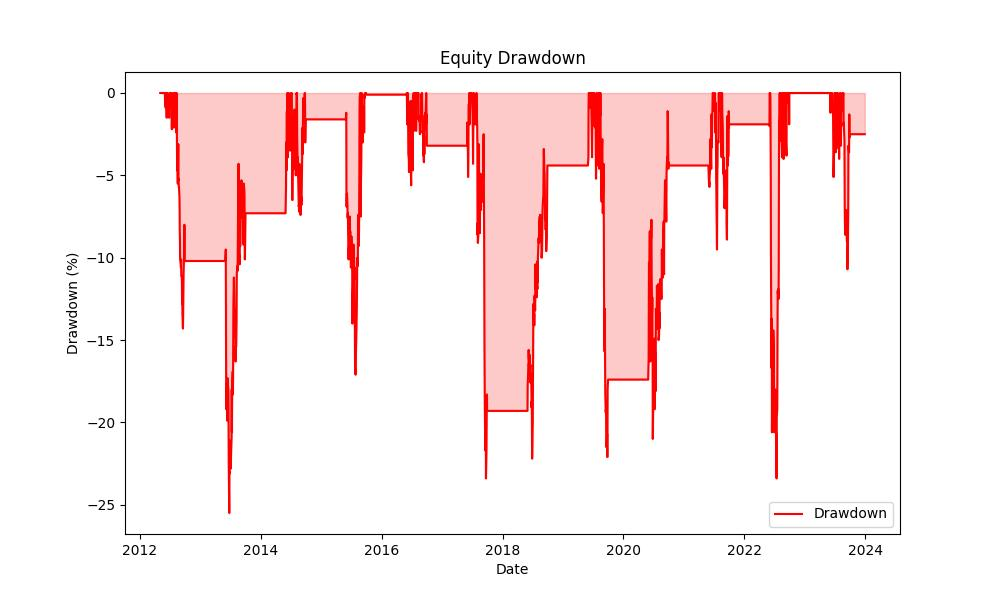
When it comes to drawdowns, which reflect declines from a peak to a trough for an investment, the maximum drawdown encountered was -25.50%. This represents the largest potential loss an investor would have experienced had they entered at the peak value before a drop. While this number may seem significant, it’s worthwhile to compare it to the buy and hold strategy’s maximum drawdown of -62.65%, highlighting a much more robust standing against market downturns.
It’s also important to consider the duration of these drawdown periods. For the seasonal strategy, the average drawdown lasted 62 days, while the longest drawdown persisted for 678 days. This information is crucial for investors to understand the typical recovery times from losses and the strategy’s ability to rebound.
By evaluating these risk management metrics, investors can gain a clearer picture of the strategy’s performance beyond mere returns. It reveals the strategy’s ability to navigate through market fluctuations and the level of risk that is being undertaken. While no strategy is without risk, these indicators suggest a considered approach to risk management within the framework of the seasonal strategy applied to The Carlyle Group Inc. Understanding these nuances is key for investors aiming to align their risk appetite with their investment strategies.
Trade Analysis
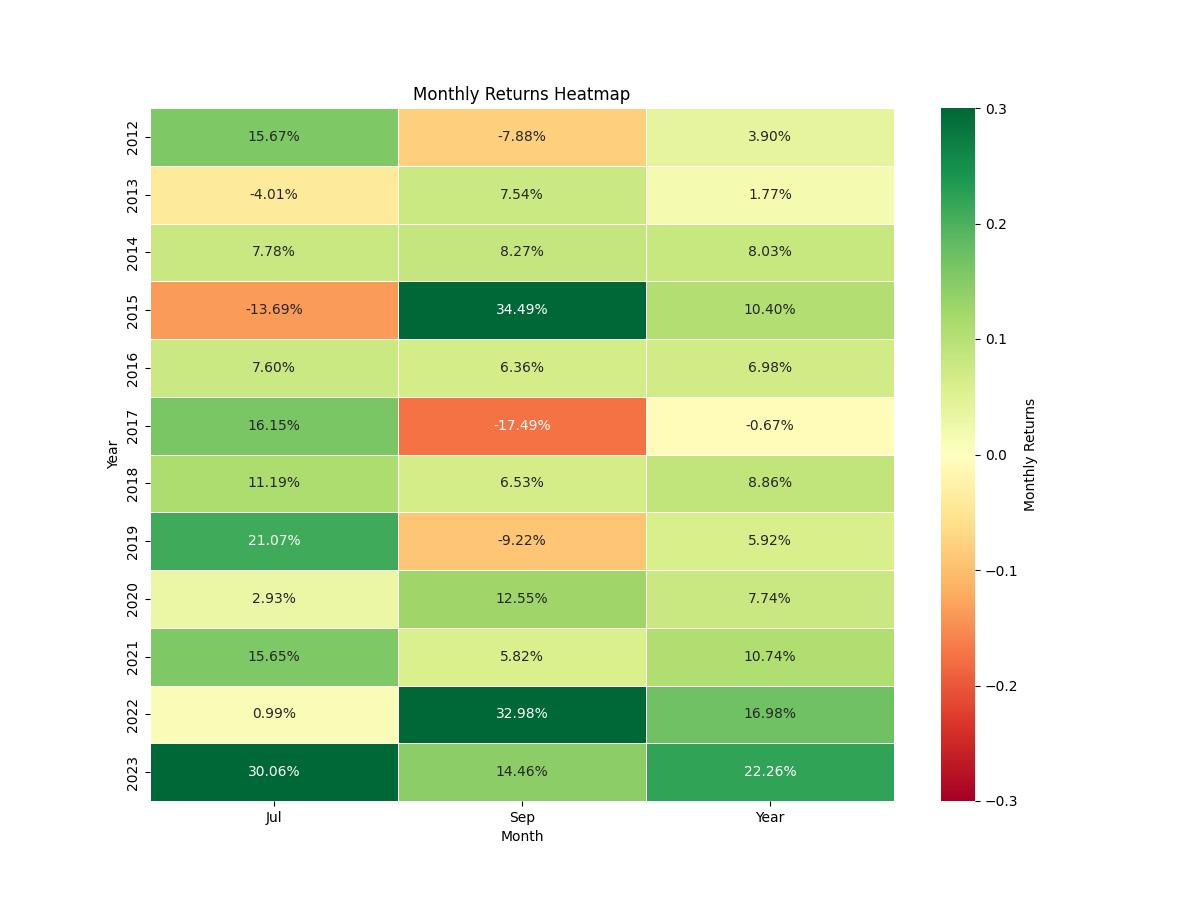
Diving into the mechanics of The Carlyle Group Inc.’s monthly seasonality trading strategy reveals a trove of actionable insights for the astute investor. Based on backtesting data, this strategy prompts traders to initiate a long position during the months of June and July and pivot to a short position for August and September. Such specificity isn’t arbitrary; it’s grounded in the granular analysis of market patterns and historical performance.
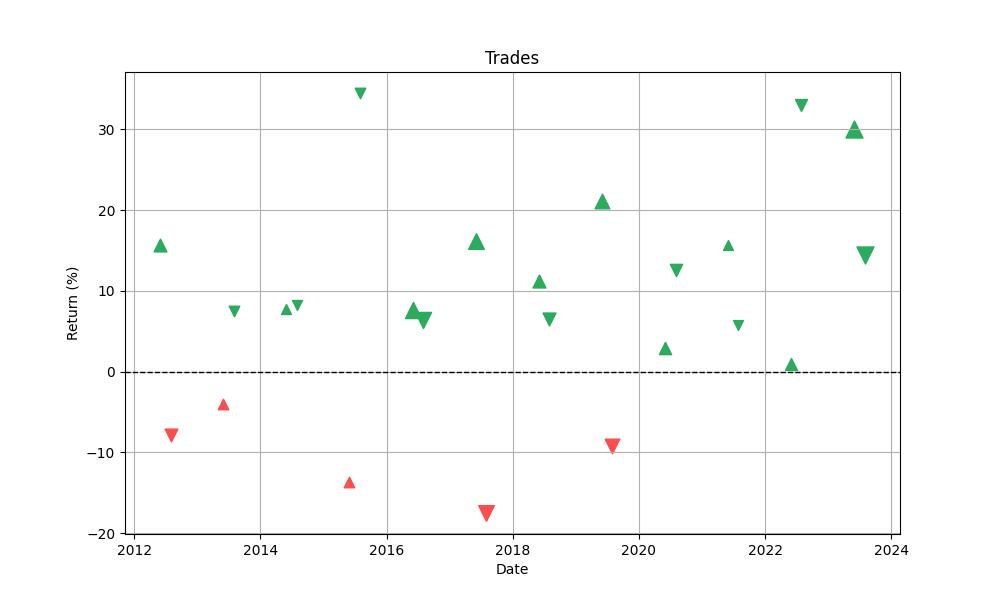
Over the course of 24 trades, this methodology has proven its efficacy with a striking win rate of approximately 79.17%. This figure alone speaks volumes about the reliability of the strategy, suggesting that nearly eight out of ten trades have been profitable. The robustness of a trading strategy can often be gauged by its win rate, and in this case, the numbers paint a promising picture.
These trades are more than mere flashes in the pan, as evidenced by the best trade yielding a remarkable 34.49% return. It’s important to note, however, that even the most meticulously devised strategies will have their share of setbacks. The worst-performing trade recorded a loss of 17.49%, a stark reminder that investing is not without its risks. Despite this, the average trade managed to deliver a hearty 7.77% return, underscoring the strategy’s potential to recuperate and thrive after less favorable market movements.
The duration of trades is another crucial facet worth examining. Each trade, on average, unfolded over approximately 62 days, with the longest trade spanning 63 days. This consistency in trade duration can be an invaluable parameter for investors who seek to anticipate the holding period for their capital and align it with their individual investment timelines.
Further reinforcing the strategy’s soundness is the Profit Factor, which sits at an impressive 4.94. This metric, which is calculated by dividing the gross profit by the gross loss of all trades, serves as an indicator of the strategy’s ability to magnify gains over losses. A Profit Factor greater than one generally indicates a successful strategy, and in this case, the figure is indicative of a strategy that has been adept at maximizing profits.
Expectancy, which represents the average amount an investor can expect to win or lose per trade, stands at 8.57%. This positive expectancy ratio further bolsters the investor’s confidence, suggesting that on average, each trade is expected to net a favorable outcome.
The Strategy Quality Number (SQN), which combines the win rate, profit factor, and drawdown to assess the overall quality of a trading system, is reported to be 2.85. A higher SQN suggests a more robust and stable strategy, and while interpretations of this number can vary, a value above 2.5 is typically seen as very good, indicating that the strategy has been performing well.
To conclude, the backtesting results of The Carlyle Group Inc.’s seasonal trading strategy offer a compelling case for its adoption. With a high win rate, strong average returns, and a high profit factor, the strategy has demonstrated the potential for consistent profitability. While past performance is not indicative of future results, these statistics provide a solid foundation for investors considering this seasonal approach to trading.
Conclusion
In summary, the exploration into The Carlyle Group Inc.’s seasonal trading strategy provides intriguing insights for investors seeking to leverage temporal market trends. The strategy’s impressive final equity, substantial total return, and solid annualized gains offer a persuasive argument for its effectiveness over the backtested period. When juxtaposed with the more traditional buy-and-hold approach, the seasonal trading method’s superior performance becomes even more apparent.
However, beyond returns, the strategy also demonstrates a prudent risk profile, as evidenced by a moderate annualized volatility, a respectable Sharpe ratio, and a much lower maximum drawdown compared to a passive strategy. This suggests a careful balance between risk and reward, a vital consideration for any investment strategy.
The trade analysis further illuminates the strategy’s strengths, revealing a high win rate, significant gains from the best trades, and a consistent average trade duration. These factors, together with a favorable Profit Factor and positive expectancy, paint a picture of a strategy that not only has the potential to provide returns but does so with a level of reliability and efficiency.
While the results of this backtest are encouraging, it is crucial for investors to remember that no strategy can guarantee future success, and past performance is not always indicative of future results. Nevertheless, the data presented here offers a strong case for considering seasonal trading strategies as a part of a diversified investment approach. The Carlyle Group Inc.’s stock, through the lens of this analysis, exemplifies how a discerning use of seasonality could potentially enhance an investor’s portfolio, providing an edge in the complex dance of market timing and strategic execution.

“Make the invisible visible. My goal is to shine a light on the subtle seasonal signals in the stock market, providing investors with the insight needed to make informed decisions. By breaking down the complexities of seasonality, I strive to empower our audience with knowledge and foresight, turning data into action.”