


Introduction
As the leaves change color and the air grows crisp, so too do the dynamics of the stock market ebb and flow with the seasons. For investors keen on understanding and utilizing these cyclical patterns, the concept of market seasonality is as rich and nuanced as the weather patterns that characterize the turn of each year. In this exploration of temporal market trends, we will unveil how the intricate dance of time can influence the performance of stocks and how savvy investors can potentially harness this rhythm to their advantage.
Imagine a world where the historical echoes of the market’s past whisper insights into the future. This is the realm of seasonal trading strategies, where the calendar itself becomes a tool in an investor’s arsenal. Take US Foods Holding Corp. (USFD), for instance, a titan in the food distribution landscape. By delving into years of market data, patterns begin to emerge like constellations in the night sky, guiding the way toward informed trading decisions.
In the intricate tapestry of the stock market, each thread represents a potential opportunity, a chance to weave profit from pattern. As we delve into the seasonality of stock markets and the trading strategies that emerge from these patterns, we invite you to join us on a journey through time and commerce, where the careful analysis of months and market trends can unlock doors to investment success. Welcome to the intersection of chronology and economy, where each tick of the clock is a beat in the market’s heart and every calendar page turned is a step on the path to potential prosperity.
Company Overview
US Foods Holding Corp. (USFD), a leading foodservice distributor in the United States, stands out for its comprehensive offerings and focus on customer satisfaction. The company boasts a diverse product portfolio, ranging from fresh produce and proteins to culinary supplies and equipment, catering to the needs of restaurants, healthcare facilities, schools, and hospitality venues. USFD’s extensive distribution network ensures efficient delivery to customers across the country, while its value-added services, such as customized culinary solutions and marketing support, enhance its customer proposition. The company’s operational model emphasizes cost-effective sourcing, efficient distribution, and a customer-centric approach. USFD’s growth strategy involves expanding its product offerings, enhancing its e-commerce platform, and targeting new customer segments. Operating in the highly competitive foodservice industry, USFD faces challenges from both established players and emerging disruptors. However, its strong brand recognition, vast distribution network, and commitment to innovation position it well for continued success.
Strategy Overview
US Foods Holding Corp. (USFD), a prominent player in the food distribution industry, has been the subject of an intriguing monthly seasonality trading strategy, which has captured the attention of investors looking to capitalize on temporal market patterns. The strategy, meticulously backtested from May 26, 2016, to December 29, 2023, spans over 2773 days of market activity, providing a comprehensive look at its potential efficacy.
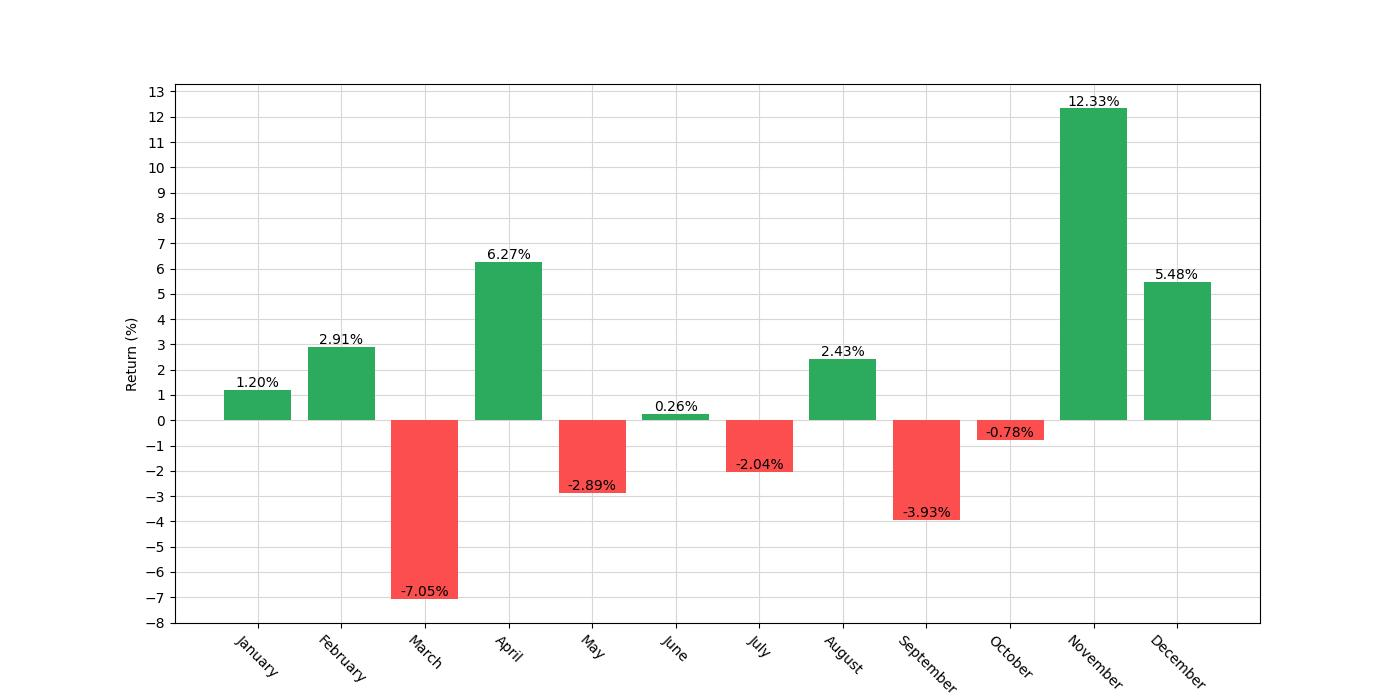
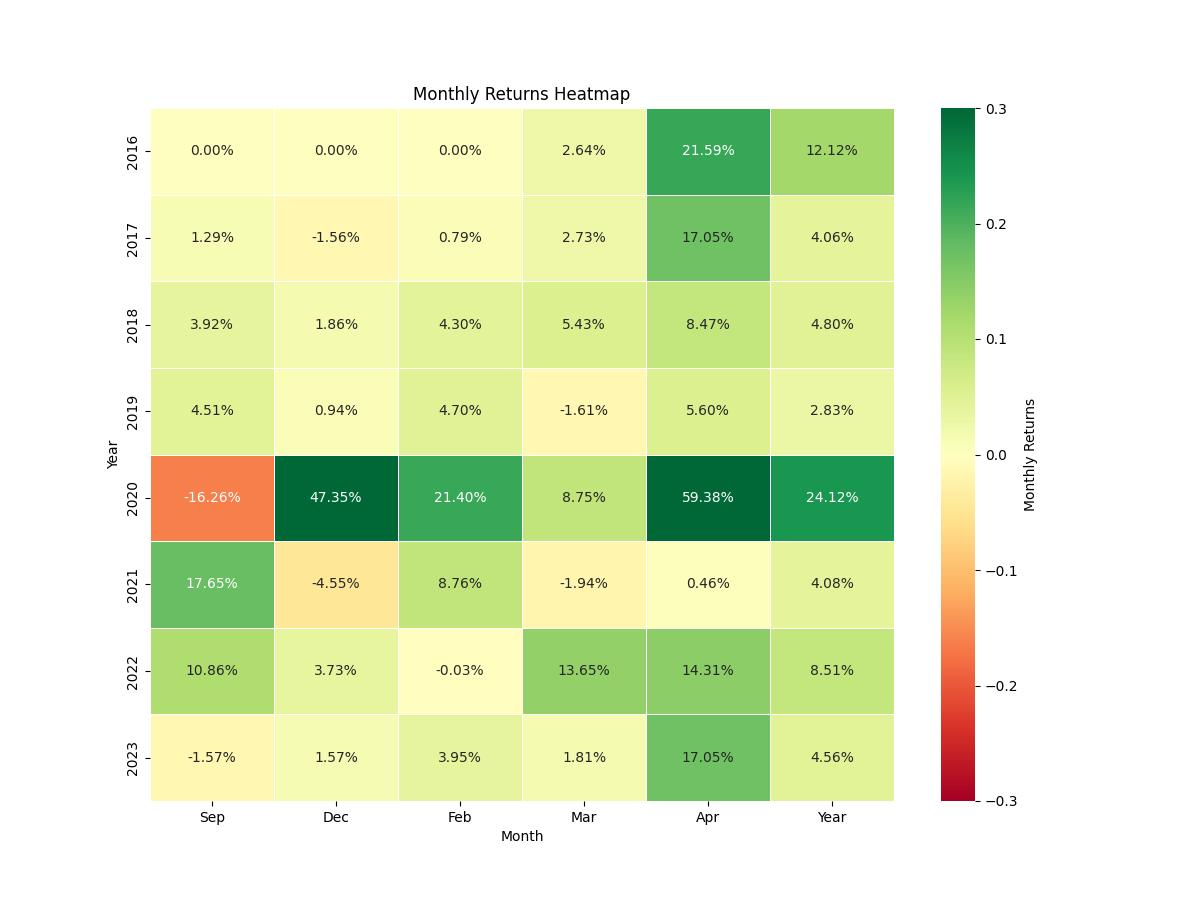
At the heart of this strategy is the selection of specific months to establish long or short positions based on historically observed market trends. Investors following this approach would enter long positions during the months of February, April, November, and December. Conversely, they would take short positions in March and September. This methodical approach to trading is based on the assumption that these months exhibit consistent patterns that can be exploited for profit.
The backtest results are based on an initial capital investment of $10,000, and it’s important to note that the strategy does not account for the impact of commissions or slippage, which could affect real-world returns. Throughout the testing period, the strategy’s market exposure was calculated to be 49.58%, indicating that during approximately half of the time, the capital was actively deployed in the market following the predefined rules.
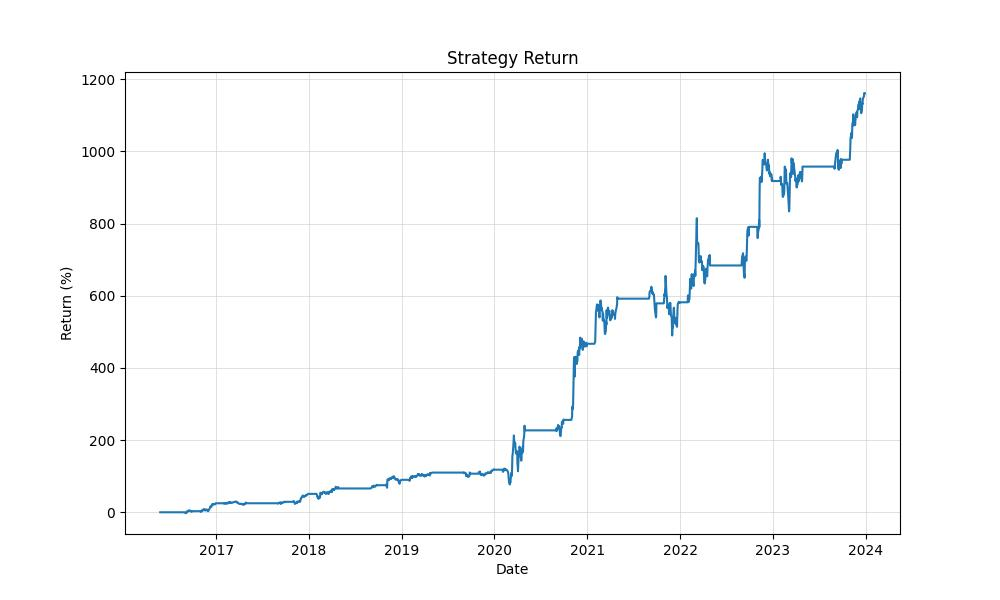
This temporal investment strategy showcases a compelling narrative when examining its performance metrics. The equity at the conclusion of the backtesting period stood at an impressive $126,120.88, with the equity peak slightly higher at $126,203.89. These figures translate to a return of 1161.21% over the test period, significantly outstripping the buy and hold return of 82.30% for the same timeframe.
When annualized, the strategy’s return stands at 39.66%, a figure that commands attention, especially when compared to the annualized buy and hold return of 8.21%. Such a stark contrast underscores the potential benefits of leveraging seasonal market trends over a simpler long-term investment approach.
The chronological span of 2773 days provided a robust testing ground for this seasonality-based trading strategy. During this time, the strategy showed that it was possible to achieve substantial growth by capitalizing on the cyclical movements of US Foods Holding Corp.’s stock, presenting a compelling case for retail investors with an eye for seasonal market patterns.
Key Performance Indicators
Investing in the stock market can sometimes feel like a voyage across a vast, unpredictable ocean, but seasoned traders often harness the power of patterns and trends, steering their portfolios with a keen eye on market seasonality. Today, we’ll delve into the performance of a strategy that capitalizes on the monthly ebb and flow of US Foods Holding Corp. (Symbol: USFD), a company deeply woven into the fabric of the foodservice industry as a leading distributor.
This strategy, which has been backtested from May 26, 2016, to December 29, 2023, advocates taking a long position during the months of February, April, November, and December, and a short position in March and September. With an initial capital of $10,000 and a market exposure time of approximately 49.58%, the strategy’s intent is to harness the potential gains from USFD’s historical monthly performance trends.
Now, let’s talk numbers – the lifeblood of any trading strategy’s validation. By the end of the backtesting period, the equity in the strategy’s account reached an impressive $126,120.88 from the initial $10,000, peaking slightly higher at $126,203.89. This represents a staggering return of 1161.21%, far outstripping the buy and hold return of 82.30%. When you annualize these returns, the strategy has yielded a remarkable 39.66%, a testament to its efficacy over the seven-year span.
In comparison, a simple buy and hold strategy would have seen a more modest annualized return of 8.21%. While the buy and hold approach is often celebrated for its simplicity and passive nature, the active engagement of this seasonality-based strategy has clearly demonstrated its potential to amplify gains, provided it aligns with the investor’s risk tolerance and investment objectives.
While the numbers are certainly eye-catching, it is important to remember that they come without the consideration of transaction costs, such as commissions and slippage, which could impact overall performance. Nevertheless, the results present a compelling case for the consideration of seasonality in trading strategies.
Understanding and managing risk is an integral part of investing, and this strategy has shown it can navigate the markets with a seasoned captain’s poise. The volatility of the strategy, which measures the degree of variation in trading returns, stood at an annualized 39.38%. This is akin to the swells and dips of the sea; a higher volatility indicates larger waves and a rougher journey, yet this strategy has a Sharpe Ratio of 1.007, indicating that the average return on investment is just over the risk-free rate of return when adjusted for its risk. This suggests that the strategy has been effective in delivering returns that compensate for the inherent risks taken.
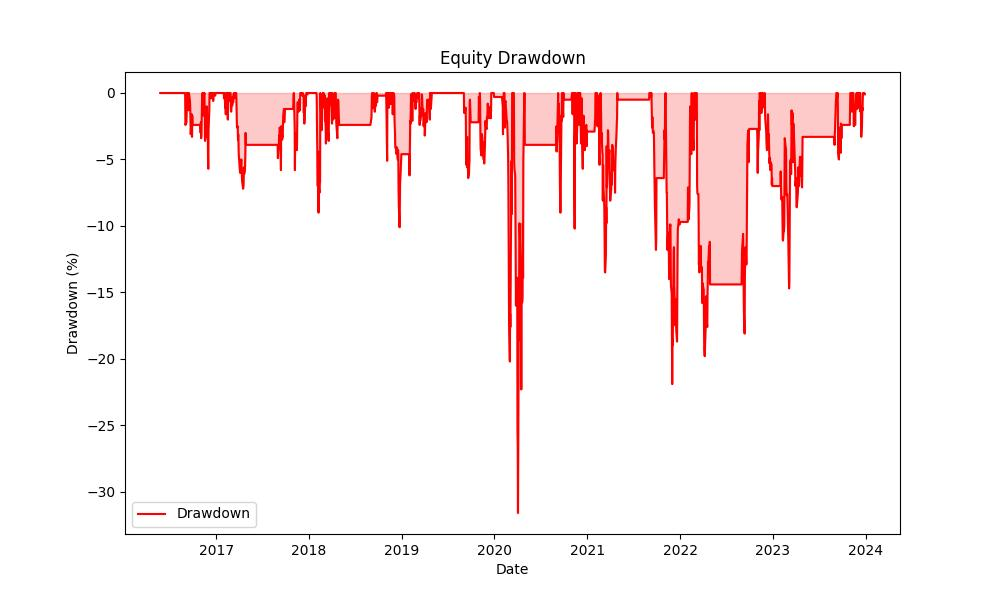
Investors who are particularly cautious about the potential for losses would be buoyed to learn that the maximum drawdown – the largest drop from peak to trough in the account’s value – was kept at -31.62%. While this is a significant dip, it is crucial to note that it is far less severe than the -77.24% maximum drawdown faced by a buy and hold strategy over the same period. The average drawdown, a smoother measure of the typical decline, was at a much more palatable -3.72%, with an average duration of these dips at 29 days.
This backtest has not only shown the potential for high returns but also the strategy’s resilience during downturns. Such performance indicators serve as a beacon for investors looking to navigate the stock market’s seasonal trends, illuminating the path toward a potentially more robust portfolio.
Risk Management
When considering any trading strategy, risk management is paramount, and the seasonal strategy applied to US Foods Holding Corp. (USFD) is no exception. The strategy’s risk profile is shaped by its annual volatility, Sharpe Ratio, maximum drawdown, average drawdown, and the duration of these drawdowns.
The annual volatility of the strategy sits at 39.38%, indicating the extent to which the investment’s returns deviate from its average return over a year. While this figure suggests a relatively high level of fluctuation in the strategy’s performance, it is essential to note that volatility is not inherently negative. For seasoned investors, this level of volatility can present ample opportunity for significant gains, though it’s crucial to recognize the potential for equally substantial losses.
A Sharpe Ratio of 1.007 is particularly enlightening as it measures the performance of an investment compared to a risk-free asset, after adjusting for its risk. A Sharpe Ratio greater than 1 is generally considered acceptable to good by investors, implying that the additional returns are adequately compensating for the extra risk taken, compared to a risk-free asset. In the case of this strategy, the Sharpe Ratio suggests that the risk-adjusted returns are reasonable and that the strategy has historically provided enough reward per unit of risk.
Maximizing gains is only one side of the coin; minimizing losses is equally important. The maximum drawdown experienced by the strategy was -31.62%, illustrating the largest peak-to-trough decline in the account’s value. This is a critical figure as it gives an investor a sense of the potential loss one may have to endure. The average drawdown, at -3.72%, provides further context by showing the average loss from any peak before a new peak is reached. While these drawdowns are part of the trading journey, their durations are also telling. The strategy faced its longest drawdown for 282 days, while on average, drawdowns lasted 29 days. This information is crucial as it helps set expectations regarding how long an investment might be in a losing position before potential recovery.
Understanding these risk metrics is essential in managing expectations and ensuring that one’s investment approach aligns with their risk tolerance and investment horizon. Anticipating the duration and depth of potential drawdowns can aid investors in maintaining a level head during the inevitable ebbs and flows of market movements. With robust risk management practices, investors can better navigate the seasonality of stock markets, leveraging strategies such as the one applied to USFD to potentially enhance their investment outcomes.
Trade Analysis
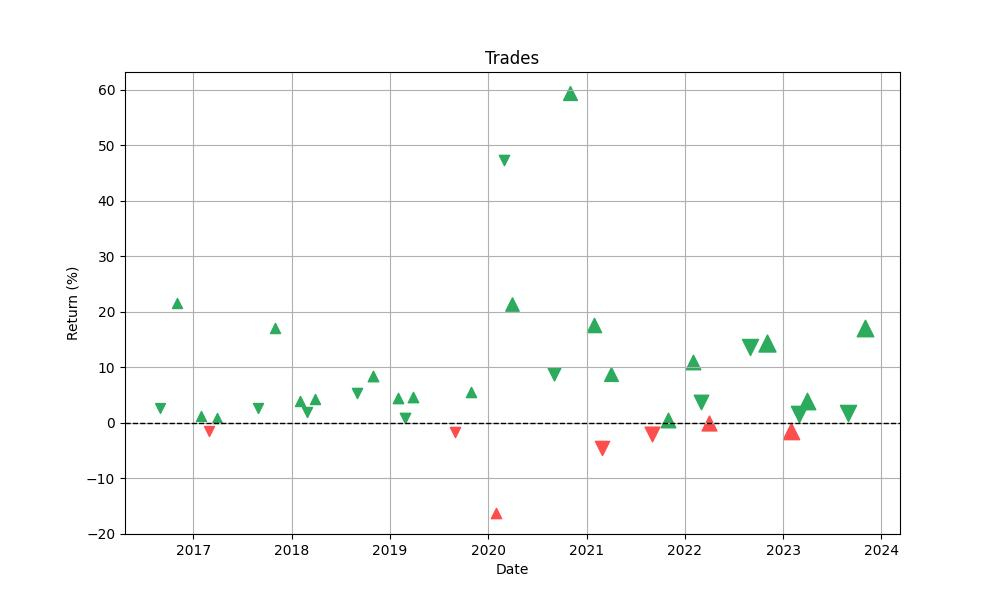
When assessing the merits of any trading strategy, one of the most telling aspects is how the strategy performs over a series of trades. This is where we dive into the granular details of the monthly seasonality trading strategy applied to US Foods Holding Corp. (USFD). Our backtest, which spans from May 2016 to December 2023, provides a robust dataset of 37 trades to analyze the effectiveness of the strategy.
Firstly, let’s talk about the win rate. For many investors, the frequency of successful trades is a top consideration. The seasonality strategy boasts an impressive win rate of 81.08%. This indicates that out of all the trades made during the backtesting period, more than 8 out of 10 trades were profitable. This high win rate is a testament to the potential reliability of the strategy and suggests that the seasonal patterns identified in USFD’s stock performance could be a strong indicator for future trading decisions.
The best trade realized during the backtest was a remarkable gain of 59.38%, which is a substantial move for any individual stock, especially when considering that this is a close-to-close monthly trading strategy. On the flip side, the worst trade experienced a loss of 16.26%, suggesting that while the strategy can yield significant gains, it is not without risk. However, the average trade yielded a gain of 7.09%, which indicates that while losses can occur, they are generally outweighed by the gains.
The duration of trades is also a critical factor for investors who need to manage their capital and time effectively. The maximum trade duration observed was 63 days, which is just over two months, while the average trade duration was 37 days, slightly over one month. This relatively short holding period aligns with the monthly seasonality approach, allowing investors to rotate capital with a moderate frequency and possibly take advantage of other opportunities in the market.
The profit factor, which is the ratio of the gross profits to the gross losses, stands at a very healthy 11.50. This figure signifies that the gross profits are more than 11 times the gross losses, underscoring the potential efficiency of the strategy in capitalizing on USFD’s seasonal trends.
Lastly, the expectancy of the strategy, which measures the average amount gained per trade, is 7.81%. This percentage provides a clearer picture of what an investor might expect on average from each trade after considering both gains and losses.
Overall, the trade analysis of the monthly seasonality strategy applied to US Foods Holding Corp. suggests that the strategy could be a compelling proposition for investors. The combination of a high win rate, substantial best trade performance, and a favorable profit factor points to a potentially advantageous approach for those looking to harness seasonal trends in their trading activities. However, as with any strategy, it’s important to recognize that past performance is not indicative of future results, and investors should always consider the inherent risks and their individual circumstances when making trading decisions.
Conclusion
In conclusion, the monthly seasonality trading strategy for US Foods Holding Corp. has presented a compelling case for its effectiveness over the backtesting period. With a staggering 1161.21% return, this strategy has far outperformed the conventional buy and hold approach, demonstrating the power of a well-researched, systematic trading plan that capitalizes on consistent seasonal trends.
The robust backtest, covering a period of over seven years, has provided investors with a detailed analysis of the strategy’s performance, showcasing impressive gains, a high win rate, and a favorable risk-adjusted return profile. The strategy’s high annualized return of 39.66% stands as a testament to the potential rewards of an active investment approach that harnesses seasonal market patterns.
However, while the results are promising, they do not account for transaction costs, and past performance does not guarantee future success. It is crucial for investors to consider the risks, including the notable maximum drawdown and the strategy’s volatility, in the context of their personal risk tolerance and investment goals.
As investors continue to seek out strategies that can provide an edge in the markets, the seasonality trading strategy detailed here offers an intriguing option. It serves as a reminder that with diligent research, disciplined execution, and a keen understanding of market trends, investors can potentially improve their chances of achieving superior returns while managing risk effectively.
Through the lens of this strategy, we can appreciate the nuanced rhythms of the stock market and the opportunities they may present. As we navigate the ever-changing seas of the financial markets, strategies like this serve as valuable navigational tools, helping investors chart a course through both calm and turbulent waters. Remember, investing is not just about the destination but also the journey, and with the right strategy, that journey can be both profitable and enlightening.

“Make the invisible visible. My goal is to shine a light on the subtle seasonal signals in the stock market, providing investors with the insight needed to make informed decisions. By breaking down the complexities of seasonality, I strive to empower our audience with knowledge and foresight, turning data into action.”