


In the intricate tapestry of the stock market, the threads of time weave patterns that savvy investors seek to discern. For those with a keen eye on the calendar, McDonald’s Corporation (MCD) presents an intriguing case study in monthly seasonality trading. Join us as we unravel the enigma of time-based strategies, and explore how a well-crafted approach can potentially add a new dimension to your investment portfolio.
Company Overview
McDonald’s Corporation stands as a global icon, renowned for its golden arches and its role as a pioneer in the fast-food industry. With its roots tracing back to 1940, McDonald’s has burgeoned into a behemoth that serves millions of customers daily across over 100 countries. The company’s menu, famed for its Big Macs, McNuggets, and Happy Meals, is complemented by a commitment to innovation and adaptation, allowing it to remain a steadfast choice for consumers amidst the ever-shifting tastes of the global palate.
Strategy Overview
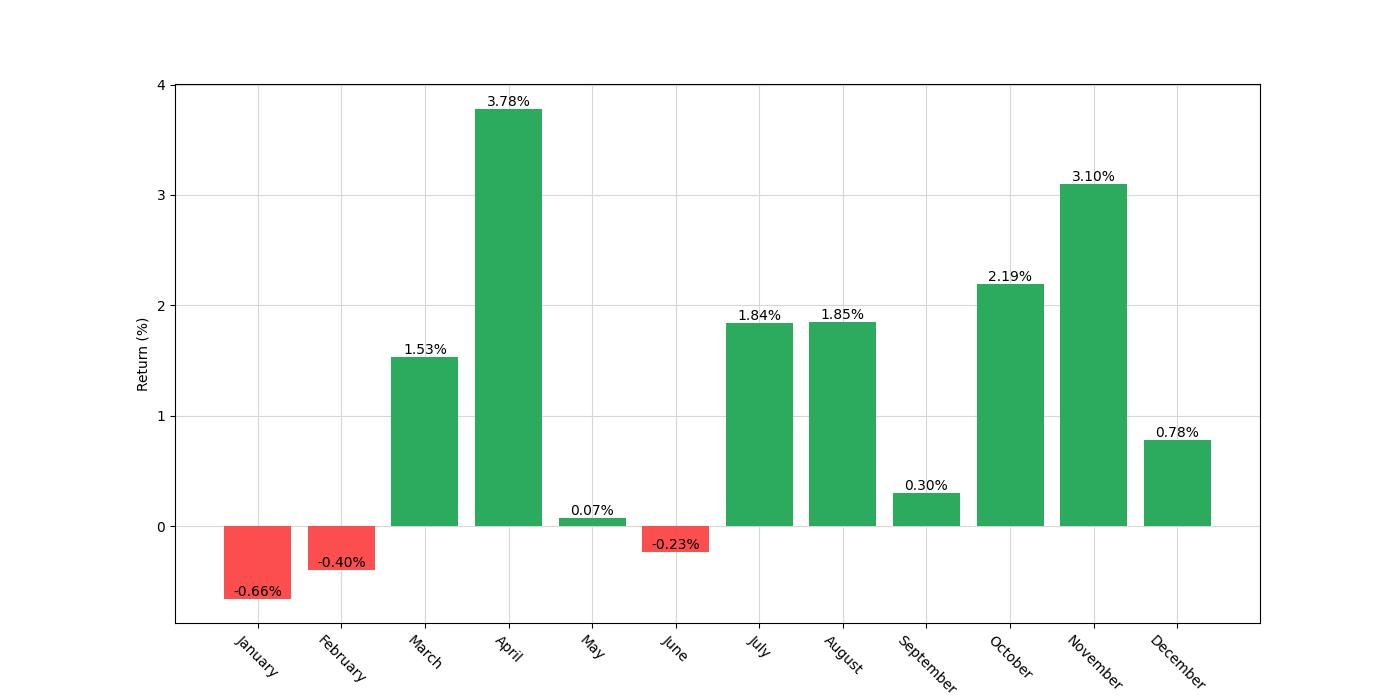
The strategy in question capitalizes on monthly seasonality patterns, particularly targeting McDonald’s stock (MCD) with a specified set of rules. Investors initiate long positions at the close of March, June, September, and October, capturing the potential upward momentum in these specific intervals. Spanning from the outset of 2003 to the close of 2022, this approach has been subjected to a 20-year test of time, with an exposure period accounting for approximately 34.64% of the time, a deliberate strategy to minimize market risk while aiming to maximize returns.
Key Performance Indicators
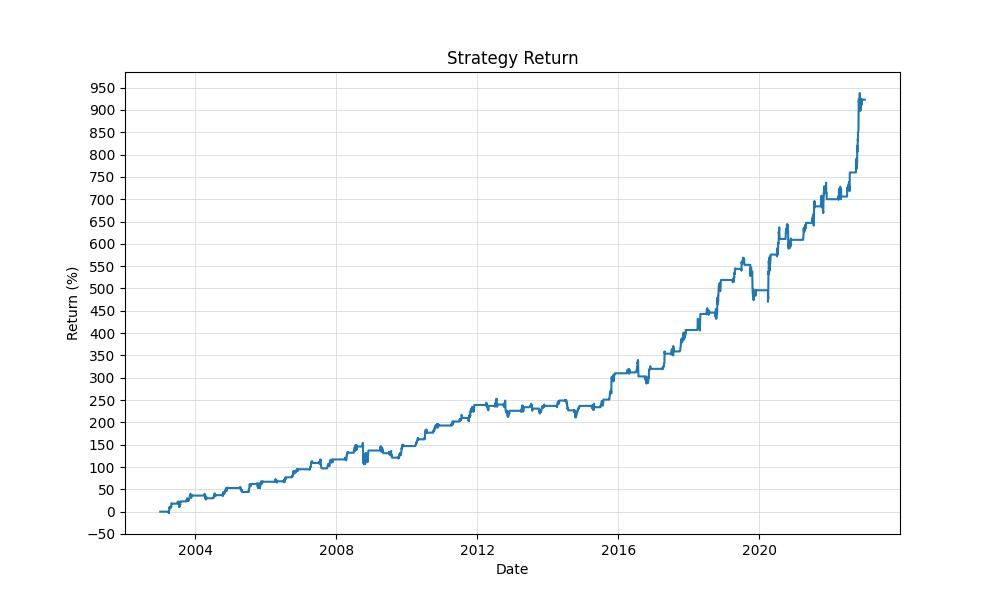
The performance of this monthly seasonality strategy is noteworthy. The initial capital of $10,000 burgeoned to $102,255, a significant increase although trailing behind the $281,236 final equity seen in a buy-and-hold strategy over the same period. The strategy’s annualized return stands at 12.34%, compared to 18.17% for buy-and-hold, yet it’s important to note the vastly reduced market exposure of the seasonal approach.
| Strategy | Buy and Hold | |
|---|---|---|
| Start Date | 2003-01-02 | 2003-01-02 |
| End Date | 2022-12-30 | 2022-12-30 |
| Duration | 7302 days | 7302 days |
| Exposure Time [%] | 34.64 | 99.96 |
| Equity Final [$] | 102255.0 | 281236.45 |
| Equity Peak [$] | 103779.76 | 292792.7 |
| Return [%] | 922.55 | 2712.36 |
| Return (Ann.) [%] | 12.34 | 18.17 |
| Volatility (Ann.) [%] | 13.88 | 25.31 |
| Sharpe Ratio | 0.89 | 0.72 |
| Sortino Ratio | 1.64 | 1.29 |
| Calmar Ratio | 0.65 | 0.49 |
| Max. Drawdown [%] | -19.01 | -36.89 |
| Avg. Drawdown [%] | -2.33 | -2.76 |
| Max. Drawdown Duration | 1170 days | 459 days |
| Avg. Drawdown Duration | 47 days | 28 days |
| # Trades | 60 | 1 |
| Win Rate [%] | 76.67 | 100.0 |
| Best Trade [%] | 18.88 | 2712.75 |
| Worst Trade [%] | -8.84 | 2712.75 |
| Avg. Trade [%] | 3.95 | 2712.75 |
| Max. Trade Duration | 63 days | 7300 days |
| Avg. Trade Duration | 41 days | 7300 days |
| Profit Factor | 5.84 | nan |
| Expectancy [%] | 4.13 | 2712.75 |
| SQN | 4.07 | nan |
Risk Management
Managing risk is paramount, and this strategy showcases a controlled risk profile. The annualized volatility of 13.88% is notably lower than the buy-and-hold’s 25.31%, suggesting a smoother investment ride. The Sharpe Ratio at 0.889 indicates a favorable risk-adjusted return, while the maximum drawdown was contained at -19.01% versus a steeper -36.88% for the passive strategy, underscoring the seasonal method’s resilience during market downturns.

Trade Analysis
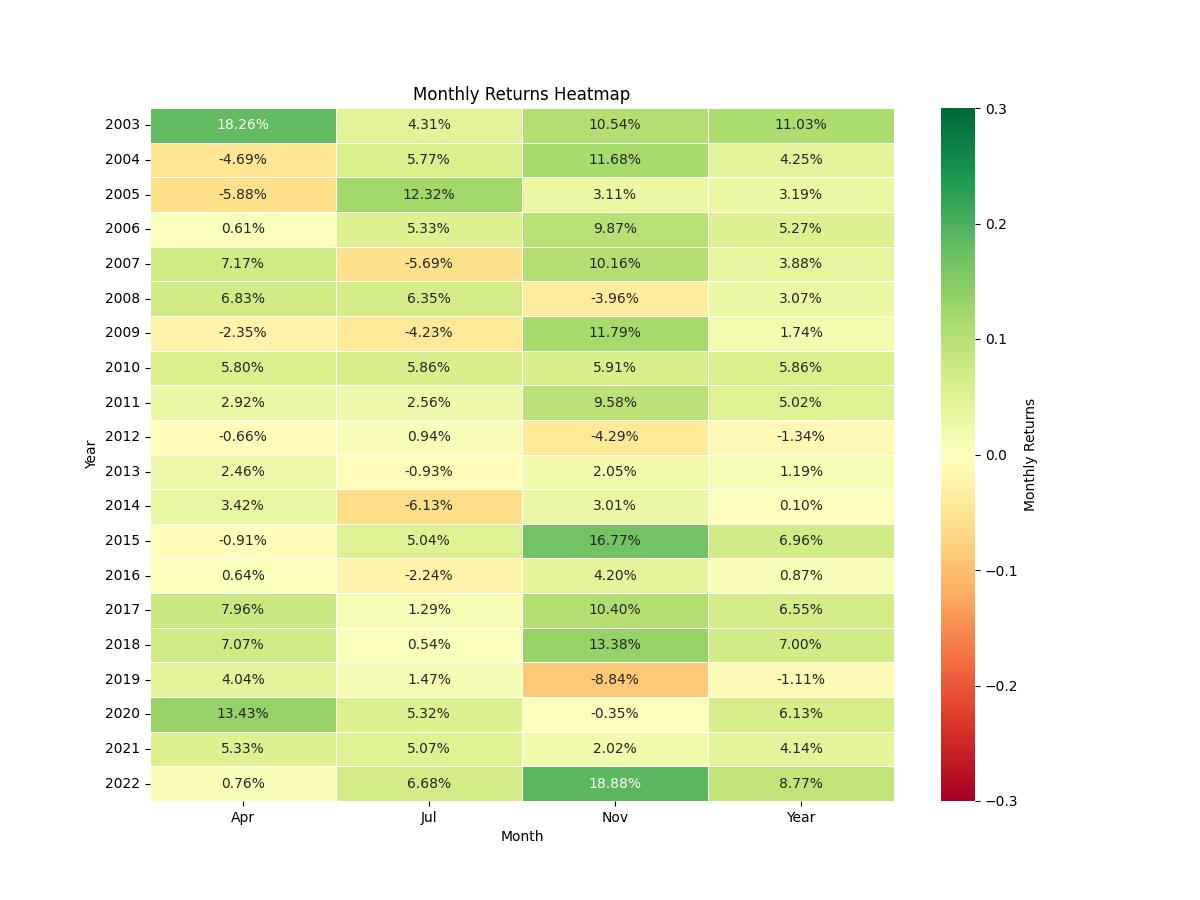
Over the two decades, the strategy executed 60 trades with an impressive win rate of 76.67%. The best trade soared with an 18.88% gain, while the worst saw a retreat of 8.84%. Trades averaged a 3.95% return, with an average duration of 41 days, reflecting the strategy’s efficacy and efficiency. A profit factor of 5.84 and an expectancy of 4.13% per trade further reinforce the strategy’s strength, demonstrating the potential for consistent gains.

Conclusion
In conclusion, the monthly seasonality trading strategy for McDonald’s presents an attractive alternative to traditional buy-and-hold investing, especially for those seeking to mitigate risk and capitalize on specific temporal market patterns. While the buy-and-hold strategy may have yielded higher overall returns, the seasonal strategy offered a smoother investment curve with fewer drawdowns, a testament to the power of strategic timing in the markets. As always, investors should consider their risk appetite and investment horizon before embarking on any trading strategy.

“Make the invisible visible. My goal is to shine a light on the subtle seasonal signals in the stock market, providing investors with the insight needed to make informed decisions. By breaking down the complexities of seasonality, I strive to empower our audience with knowledge and foresight, turning data into action.”