


Introduction
As the seasons change, so too can the landscape of the stock market, presenting a myriad of opportunities for those with the foresight to harness these temporal shifts. For many investors, the quest to navigate these fluctuations is not just about understanding the numerical ebb and flow of the markets but about decoding the rhythm of time itself. In this intricate dance with time, a fascinating pattern has emerged—one that suggests the potential for profitability lies in the very seasonality of stock performance.
Welcome to our exploration of the seasonality of stock markets and the trading strategies that thrive on these cyclical patterns. In this blog post, we will delve into the inner workings of a monthly seasonality trading strategy, applied meticulously to the case of Lumentum Holdings Inc., and reveal how historical patterns can be transformed into a strategic advantage. Join us as we unfold a narrative that goes beyond mere numbers, drawing you into a world where time itself becomes a valuable asset in the investor’s portfolio. Through this journey, we aim to equip you with the knowledge to potentially capitalize on these seasonal trends, turning the calendar into a roadmap for investment success.
Company Overview
Lumentum Holdings Inc. (LITE), a global leader in optical and photonic technology, empowers next-generation networks, sensing, and industrial applications. Renowned for its innovative optical components, lasers, and sensors, LITE caters to a vast spectrum of industries, including telecommunications, datacom, cloud computing, industrial manufacturing, life sciences, and consumer electronics. Lumentum generates revenue from sales of its products and services, primarily comprising optical amplifiers, tunable lasers, lasers diodes, photonic integrated circuits, and optical engines. The company’s solutions enhance network performance, enable faster data transmission, and facilitate cutting-edge applications such as autonomous vehicles and advanced medical imaging. Lumentum’s operational model focuses on continuous innovation, vertical integration, and strategic partnerships to maintain its competitive edge. Through targeted acquisitions and internal R&D, the company drives growth by expanding its product portfolio and addressing emerging market needs. Operating in a dynamic industry propelled by digital transformation, LITE remains well-positioned to capitalize on the growing demand for high-speed connectivity, sensing, and precision measurement technologies, cementing its position as a dominant player shaping the future of optical and photonic innovation.
Strategy Overview
In the dynamic world of stock trading, investors often seek an edge through various strategies, and one of the intriguing approaches centers around the concept of seasonality. This is the idea that stocks can exhibit patterns related to the calendar, creating opportunities for those who can identify and capitalize on these temporal trends. One such strategy that has gained attention is a monthly seasonality trading strategy, which has been applied in the backtesting analysis for Lumentum Holdings Inc., a company traded under the ticker symbol LITE.
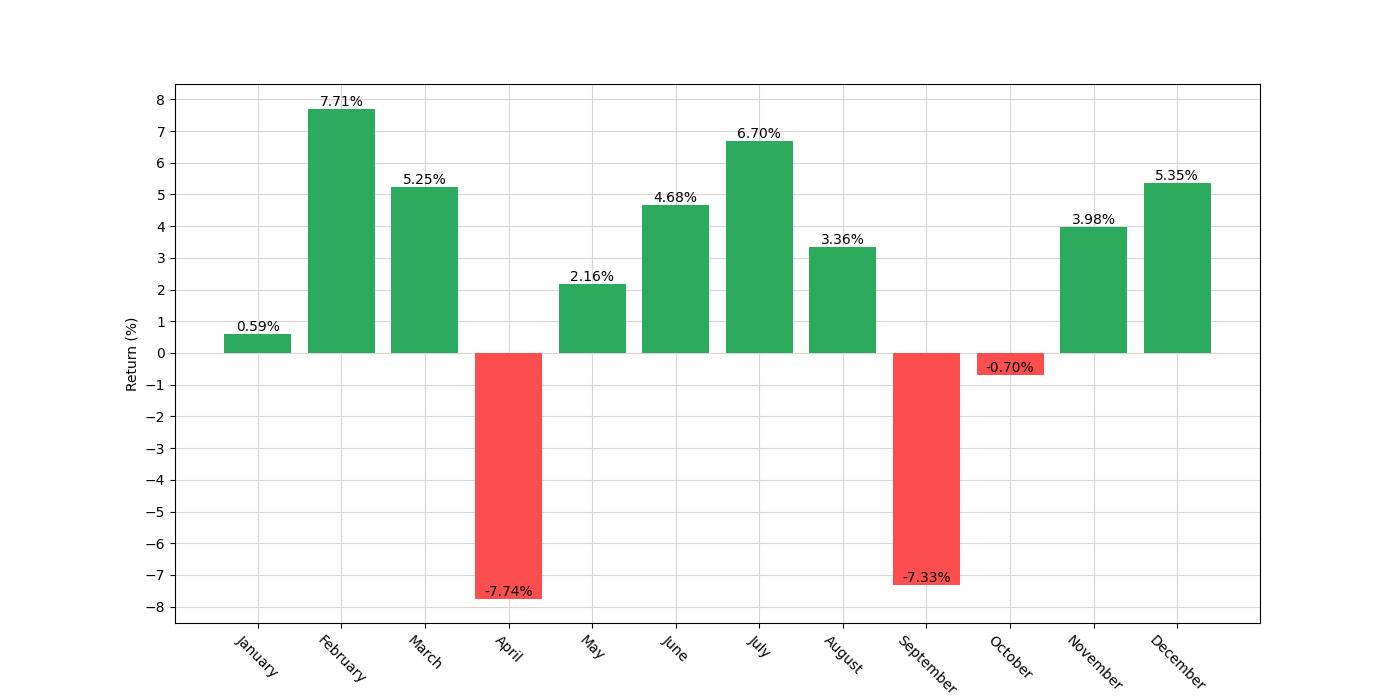
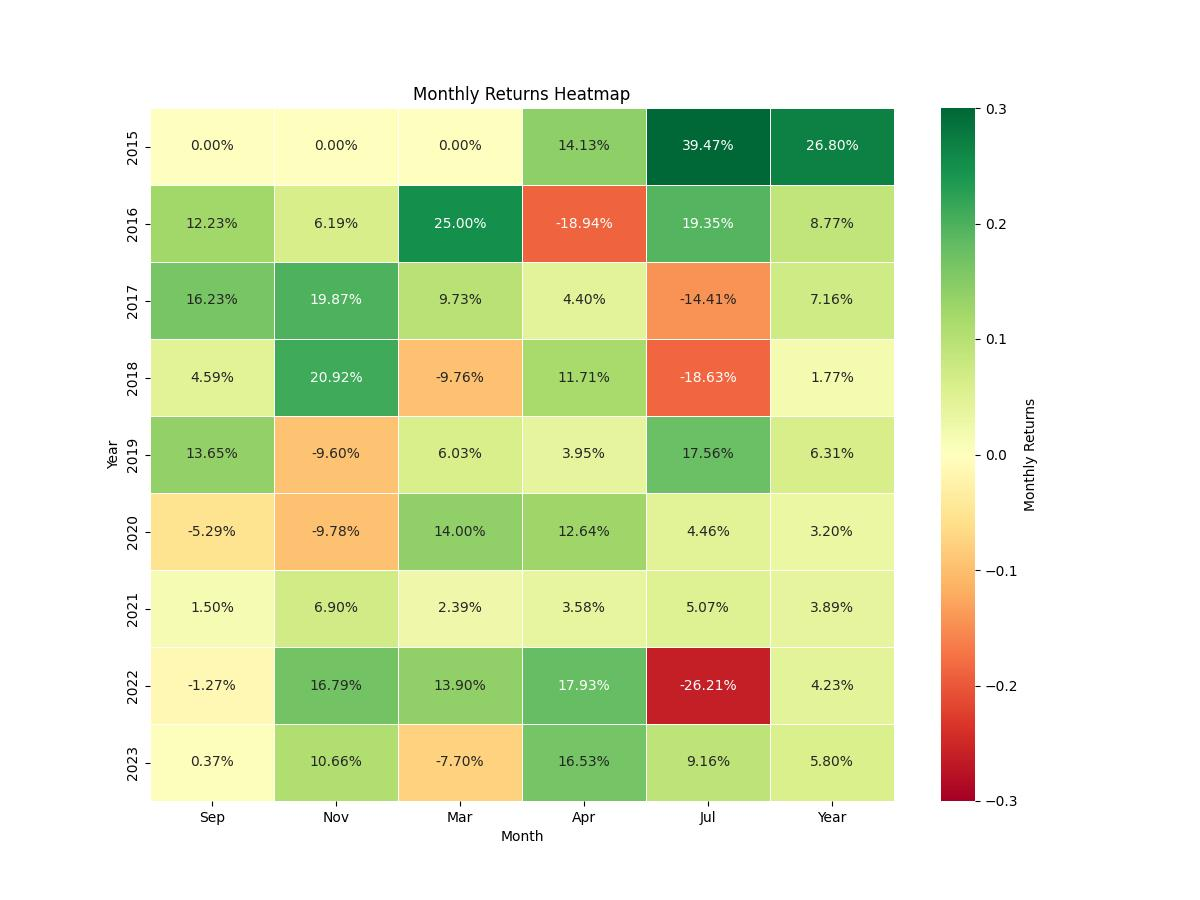
The premise is straightforward: by analyzing historical data, the strategy takes a long position during months when the stock has traditionally performed well and goes short in months where the stock has historically underperformed. Specifically, for Lumentum Holdings Inc., the strategy involves entering a long position at the close of February, June, and October, then selling at the close of the month for March, July, and November, respectively. Conversely, the strategy goes short at the close of March and August and covers the short position at the close of April and September.
This backtest, which excludes the impact of commissions and slippage for a purer sense of strategy performance, was conducted over a span of more than eight years, starting from August 4, 2015, and concluding on December 29, 2023. During this period, the strategy was in the market for approximately 43% of the time. This reduced market exposure is a key feature of the strategy, as it aims to minimize risk by only engaging the market during historically opportune times.
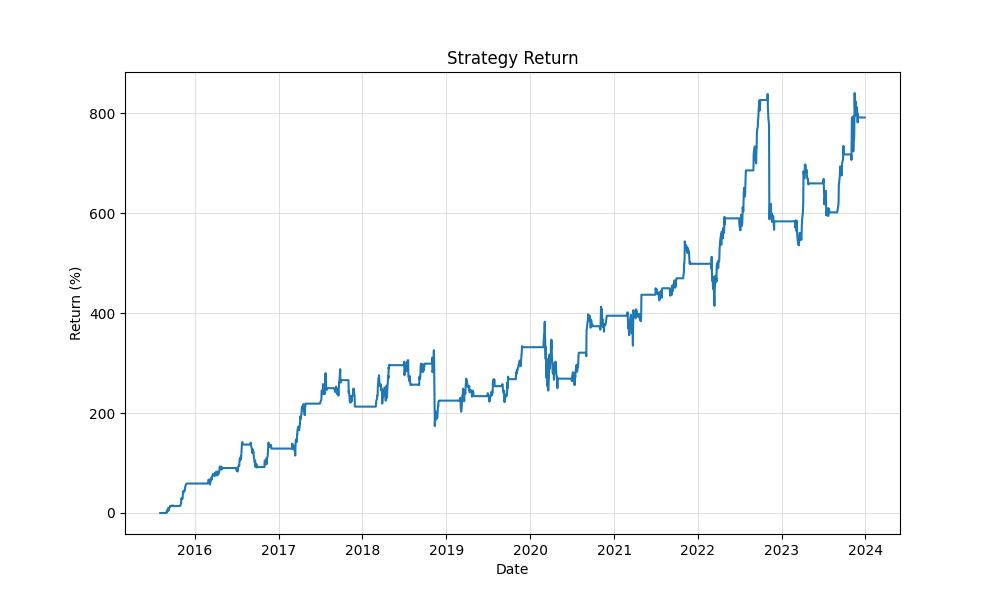
The initial capital for this backtest was set at $10,000, a figure that allows for a clear percentage-based assessment of the strategy’s effectiveness. Based on the rules set forth, this strategy managed to grow the initial capital to an impressive equity final balance of $89,241.88, with an equity peak hitting $94,120.78 during the backtest period.
The overall return generated by this seasonal strategy was 792.42%, a stark contrast to the buy-and-hold return of 147.85% over the same duration. To put this into annualized figures, which helps compare the strategy’s performance to other investment opportunities, the return per annum stood at 29.76%. This is a substantial figure that highlights the strategy’s potential to outperform more passive investment approaches over the long term.
It’s important to note that the duration of the backtest, spanning over 3069 days, was essential to observe the robustness of the strategy across different market conditions. Seasonal strategies, by their nature, require time to validate their patterns, and this extensive backtest period provides a comprehensive view of how the strategy might perform in the real world.
Key Performance Indicators
In the financial arena, evaluating the success of a trading strategy is akin to a performance review, providing invaluable insights into its effectiveness. For investors eyeing the stock of Lumentum Holdings Inc., a company at the forefront of optical and photonic products, a particular monthly seasonality trading strategy has demonstrated a compelling track record.
Over the course of 3069 days, from August 4, 2015, to December 29, 2023, this strategy has transformed an initial capital of $10,000 into a remarkable $89,241.88. When we set this figure against the peak equity value the strategy achieved, which was $94,120.78, the impressive nature of the growth becomes evident.
To put this into perspective, this strategic maneuvering yielded a total return of 792.42%, an astronomical leap when compared to the 147.85% return that a simple buy-and-hold approach would have garnered over the same period. The nuanced brilliance of this strategy is further underscored by its annual return rate of 29.76%, a testament to its consistent performance over time.
But what do these numbers mean for the average investor? They translate into a strategy that not only multiplies capital but does so at a rate that far outpaces the organic growth trajectory of the stock.
While the annualized return paints a picture of success, it’s essential to understand this growth didn’t occur in a vacuum. It was achieved with the backdrop of market volatility, which for this strategy stood at 41.65% annually. This figure is akin to the choppiness of the seas in which our investment vessel navigated. Despite these undulating waves, the strategy maintained a steady course, as evidenced by the Sharpe Ratio of 0.7145, indicating that the returns were achieved with a reasonable level of risk relative to the volatility experienced.
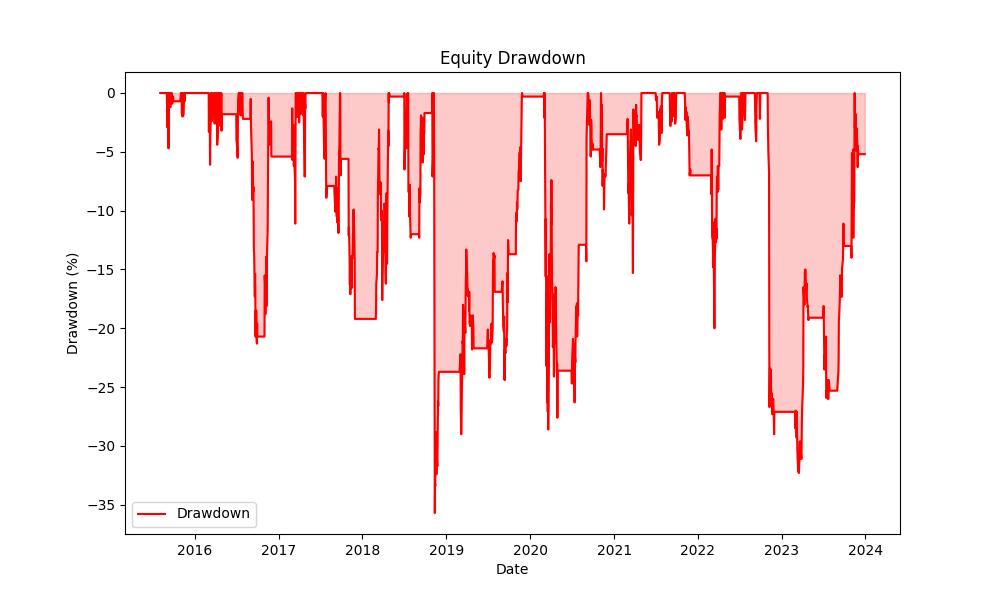
Still, the path to prosperity in the stock market is rarely a straight line, and this strategy was no exception. The maximum drawdown—a measure of the largest single drop in value—was 35.68%, a figure that may cause concern for the risk-averse. However, the average drawdown was a more modest 5.80%, suggesting that while the strategy had moments of significant downturns, its typical ebbs were less severe. Moreover, the average drawdown lasted a mere 47 days, indicating that any dips were relatively short-lived before a return to growth.
The ability of a trading strategy to weather financial storms and emerge stronger is embodied by the Calmar Ratio, which for this strategy stands at 0.8342. This metric demonstrates a robustness, suggesting that the strategy’s performance is commendable even when factoring in the potential risks and downturns.
Risk Management
When delving into the intricacies of a trading strategy, it’s imperative for investors to scrutinize the associated risks and the strategy’s ability to manage them effectively. In the case of the monthly seasonality trading strategy applied to Lumentum Holdings Inc., a number of risk indicators provide a comprehensive view of its performance from August 2015 to December 2023.
Firstly, the annualized volatility, a measure of the strategy’s variability, stood at 41.65%. This indicates a moderately high level of fluctuations in the strategy’s returns compared to the broader market. While volatility can often be associated with risk, it is also a component of reward, as higher volatility can lead to greater gains. However, it is essential for investors to consider their risk tolerance when engaging with strategies that exhibit such levels of volatility.
The Sharpe Ratio, a metric used to understand the risk-adjusted return, for this strategy, is 0.7145. This suggests that for every unit of risk taken, the strategy has historically provided a return of 0.7145 units. While this ratio is positive, indicating that the strategy has provided an excess return over the risk-free rate, investors should note that it reflects moderate performance, where higher values would typically indicate a more attractive risk-adjusted return.
A critical component of risk management is understanding the potential for losses, which is where the Max. Drawdown comes into play. For this strategy, the maximum loss from peak to trough was -35.68%. This drawdown is a significant consideration; it shows the largest potential loss an investor could have experienced during the specified period. The average drawdown, though less severe at -5.80%, still provides insight into typical declines during the strategy’s operation.
Furthermore, the duration of these drawdown periods can impact investor sentiment and strategy adherence. The maximum drawdown duration was recorded at 384 days, which is a considerable amount of time to be in a loss position. In contrast, the average drawdown duration was 47 days, reflecting the typical time it took for the strategy to recover from smaller losses.
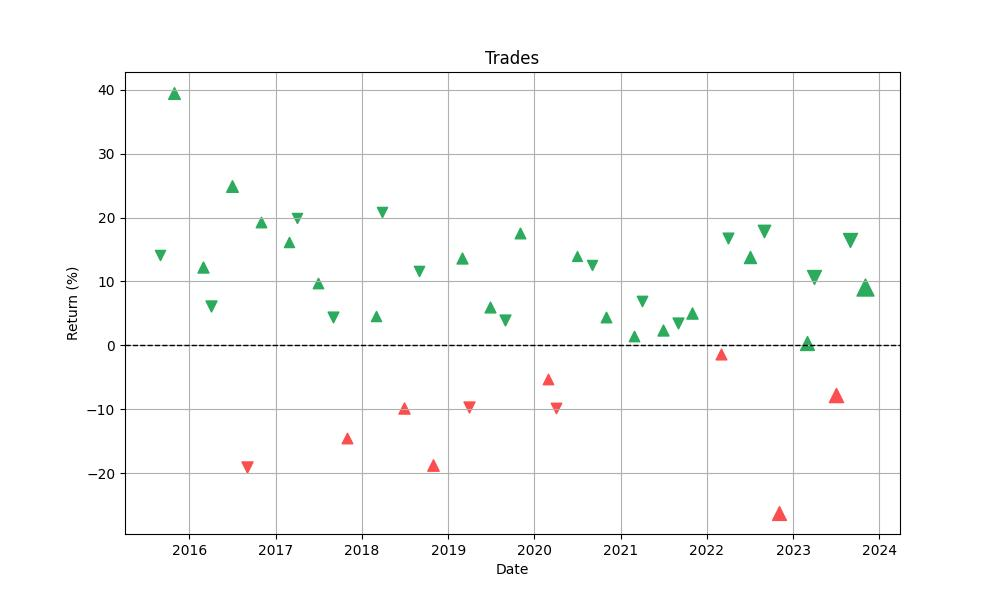
A comprehensive risk management strategy will also consider the consistency and reliability of returns. With 42 trades executed over the backtesting period, the strategy demonstrated a win rate of 76.19%. This high win rate could indicate a potentially lower risk of loss per trade. The best trade yielded a significant 39.47% return, while the worst trade marked a loss of -26.21%, illustrating the range of outcomes investors might expect.
The average trade yielded a 5.35% return, which is a robust figure that suggests the strategy has been effective in capitalizing on the seasonal tendencies of Lumentum Holdings Inc.’s stock. The trade durations further reinforce the strategy’s effectiveness, with the maximum trade lasting 33 days and the average trade duration mirroring this at 31 days, indicating consistent holding periods aligned with the monthly seasonality premise.
The Profit Factor, which is the ratio of gross profits to gross losses, stands at 3.13. This is a strong indicator that the gains of the strategy substantially outnumber the losses, a reassuring sign for investors seeking strategies that tilt the balance toward profitability. Additionally, the Expectancy of 6.17% gives investors an average value of expected return per trade, factoring in both wins and losses, which in this case, suggests positive expected outcomes.
Trade Analysis
In the realm of trading, the proof of performance lies in the numbers, and dissecting the intricacies of trade data can offer a treasure trove of insights for the discerning investor. When we delve into the trading strategy applied to Lumentum Holdings Inc. (Symbol: LITE), a pattern of strategic monthly seasonality emerges, with a series of long and short positions orchestrated to capitalize on historical monthly trends.
Over the course of 42 trades, the strategy demonstrated a robust win rate of approximately 76.19%, underscoring the efficacy of the seasonality approach. This high win rate is indicative of a strategy that has consistently identified periods where the stock’s performance tends to exhibit predictable patterns. For an investor, such reliability is a beacon of confidence, as it suggests a certain level of predictability in an otherwise volatile market landscape.
The best trade realized a staggering gain of 39.47%, a figure that can make a significant impact on an investment portfolio. On the flip side, even the most thought-out strategies encounter setbacks, and this strategy was no exception, with its worst trade marking a 26.21% loss. The disparity between the best and worst trades underscores the importance of maintaining a level-headed approach, as the market can serve both fortune and adversity.
The average trade gain of 5.35% further cements the strategy’s strength. This average is not simply a number but a testament to the strategy’s ability to perform consistently over time, which is crucial for long-term investment growth. With an average trade duration of 31 days, the strategy appears to be designed for the intermediate-term investor, balancing the need for market exposure with the flexibility to adjust to changing market conditions.
The Profit Factor, which stands at 3.13, offers an encouraging perspective; the gross profits are more than three times the gross losses. This ratio is a strong indicator of the strategy’s overall profitability and its potential to cushion against the inevitable losing trades. An Expectancy of 6.17% further exemplifies this point, suggesting that on average, each trade is expected to yield a positive return, factoring in both wins and losses.
The concept of System Quality Number (SQN) is another critical component, and with a value of 1.96, the strategy is characterized as having a sound system, indicative of a stable and consistent edge in the market.
When investors consider these numbers, they’re not just looking at cold, hard data. They’re seeing a narrative unfold—a narrative of a carefully crafted strategy that leverages the cyclical nature of the markets, demonstrating resilience and the potential for profit in the face of market ebbs and flows. This analysis isn’t merely about past performance; it’s about understanding the strategic underpinnings that can help guide future investment decisions. With a strategy that has shown a high win rate, a favorable profit factor, and a positive expectancy, investors have substantial reasons to take a closer look at the seasonal patterns that have historically influenced Lumentum Holdings Inc.’s stock performance.
Conclusion
As we reach the conclusion of our exploration into the monthly seasonality trading strategy for Lumentum Holdings Inc., it’s crucial to reflect on the profound insights gleaned from our comprehensive analysis. The historical performance of this strategy has painted a picture of significant potential, yielding an impressive total return of 792.42% over the span of 3069 days. This starkly contrasts with the more modest gains of a traditional buy-and-hold approach, underscoring the power of strategic timing and market awareness.
Key performance indicators have illuminated the strategy’s robustness, with a notable annualized return of 29.76% and a Sharpe Ratio that suggests reasonable risk-adjusted returns. The win rate of approximately 76.19% and a profit factor of over 3 signal a strong likelihood of continued success, albeit with the understanding that past performance does not guarantee future results.
Risk management assessments have been paramount, revealing both the strategy’s vulnerabilities and its resilience. A maximum drawdown of 35.68% serves as a cautionary tale of the risks inherent in trading, reminding investors of the importance of risk tolerance and the potential for significant downturns. However, the strategy’s ability to navigate these downturns with relatively short recovery periods presents a compelling argument for its efficacy.
Trade analysis has further fortified the strategy’s credibility, showcasing a consistent ability to capitalize on the seasonal tendencies of Lumentum Holdings Inc.’s stock. The intermediate-term trade durations align well with the strategy’s premise, offering investors a blend of market exposure and adaptability.
In considering the entirety of our findings, it’s evident that the monthly seasonality trading strategy presents a compelling case for investors seeking to optimize their engagement with the stock market’s temporal patterns. While no strategy is immune to market fluctuations, the strategic application of seasonal trends can provide a discernible advantage, harnessing the cyclical nature of stock performance to potentially enhance portfolio growth.
It is incumbent upon investors to approach this strategy with a balanced perspective, weighing the potential rewards against the risks, and to integrate it into a diversified investment approach. As with all investment decisions, due diligence, a clear understanding of one’s financial goals, and risk tolerance are paramount.
In summary, the monthly seasonality trading strategy for Lumentum Holdings Inc. offers a window into the nuanced interplay between time and market dynamics, serving as a testament to the potential of informed, strategic trading. With a solid foundation built on historical data and a clear articulation of risk and return, investors may find that this strategy aligns well with their pursuit of financial growth in the rhythmic dance of the stock market.

“Make the invisible visible. My goal is to shine a light on the subtle seasonal signals in the stock market, providing investors with the insight needed to make informed decisions. By breaking down the complexities of seasonality, I strive to empower our audience with knowledge and foresight, turning data into action.”