

Introduction
In the ever-shifting landscape of the stock market, investors are constantly seeking ways to enhance returns while managing risk. The rhythm of the market often dances to a seasonal beat, with certain periods historically showing more favorable conditions than others. As an astute investor or curious newcomer, understanding these cyclical patterns can be the key to unlocking investment strategies that not only align with market dynamics but also cater to one’s appetite for risk and return.
In this exploration, we will delve into the intriguing concept of stock market seasonality and its application to trading strategies. Specifically, we will break down a decade-long strategy focused on Burlington Stores, Inc., which has shown that timing is not just everything—it’s the only thing. This strategy, based on the historical performance of the stock during selected months, presents a compelling case for the informed investor looking to harness the seasonal ebbs and flows of the market.
Our journey will take us through a detailed analysis of the strategy’s performance, risk management techniques, and the granular insights of trade analysis. By the end of this deep dive, you’ll have a comprehensive understanding of how strategic seasonal investments can potentially lead to outsized gains, and why sometimes, the calendar might be the most valuable tool in an investor’s arsenal.
Company Overview
Burlington Stores, Inc., a leading off-price retailer in the United States, offers a wide selection of high-quality, brand-name merchandise at substantial discounts. With over 1,000 stores nationwide, Burlington caters to a value-conscious, style-savvy customer base. The company’s core products and services include apparel, footwear, accessories, home décor items, and gifts. Burlington targets families and individuals looking for affordable fashion and home goods. Its revenue streams primarily come from the sale of discounted brand-name products, generating a gross profit margin of around 30%. Burlington’s value proposition lies in providing customers with a treasure hunt shopping experience, where they can find brand-name products at deep discounts. With its efficient operational model, the company manages costs effectively, enabling it to offer competitive prices. Burlington’s growth strategy focuses on expanding its store base, enhancing its omnichannel capabilities, and improving the customer experience. Operating in the highly competitive off-price retail industry, Burlington faces competition from major players like Ross Stores and TJX Companies. However, Burlington has managed to maintain its market position through its unique value proposition and strong brand recognition. Overall, Burlington Stores stands as a compelling investment opportunity due to its consistent growth, attractive valuation, and solid financial performance.
Strategy Overview
Embarking on a journey through the stock market’s ebb and flow, we find ourselves examining a specific trading strategy that harnesses the power of monthly seasonality. This approach pivots on the premise that certain months tend to display consistent patterns of performance for stocks. In our case, we’re focusing on Burlington Stores, Inc., a company traded under the ticker symbol BURL.
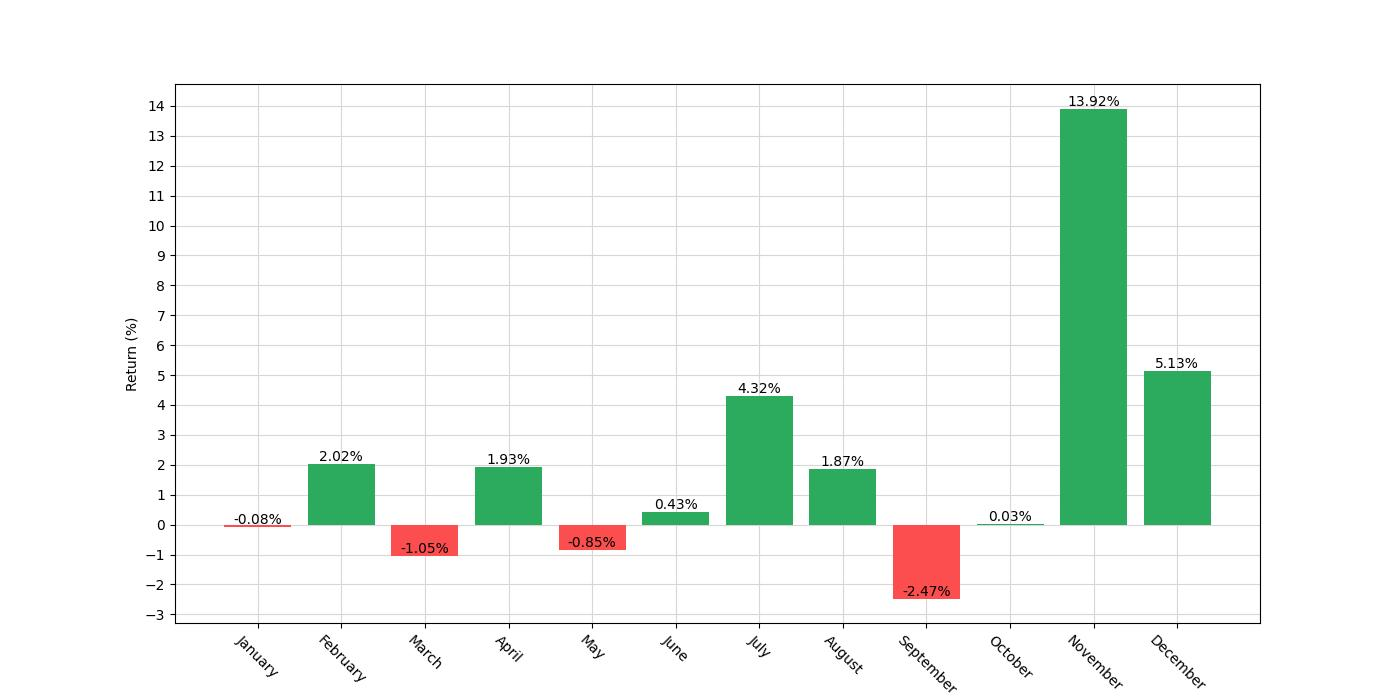
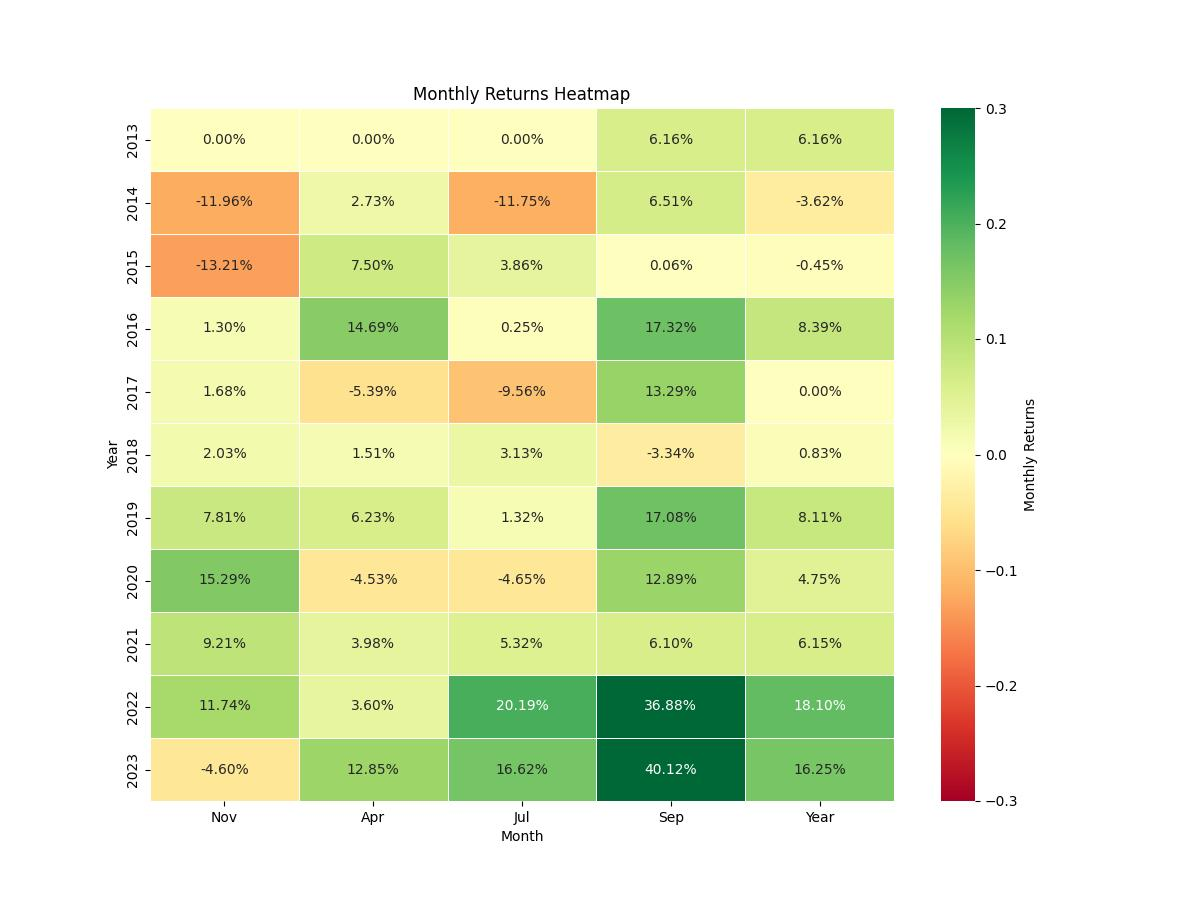
The strategy is straightforward in its construction: it operates on a close-to-close basis, where positions are initiated at the closing price of one month and closed at the end of the target month. Specifically, the rules dictate entering into a long position during the months of April, July, and November. Conversely, a short position is adopted for the month of September. This pattern is rooted in historical performance data, suggesting that these particular months offer predictable behaviors that can be capitalized upon.
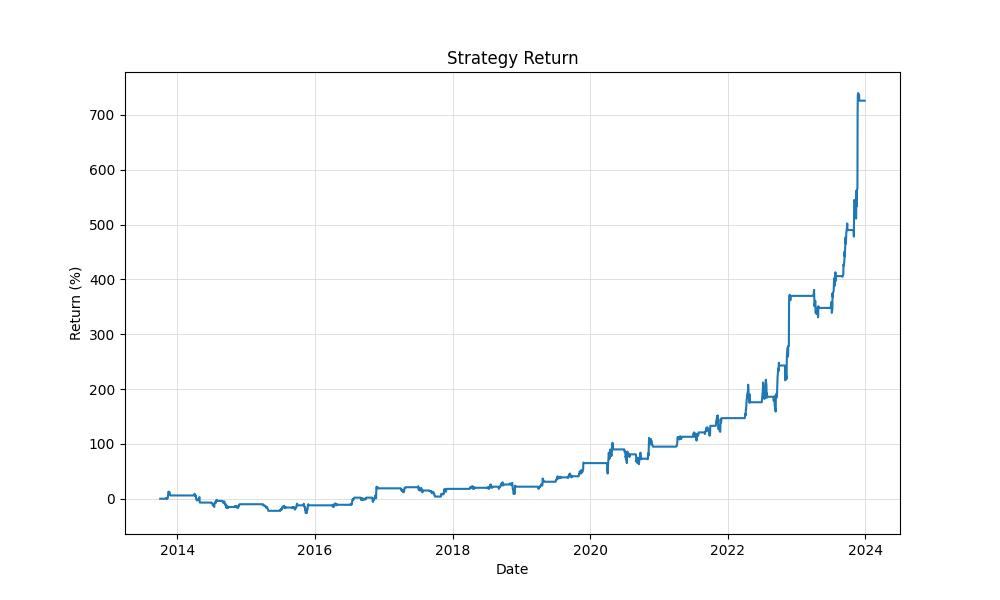
This backtested strategy spans a decade, kicking off on October 2, 2013, and drawing to a close on December 29, 2023. Over these 3,740 days, the strategy was exposed to the market for approximately 34.35% of the time. It’s important to note that this exposure time represents the periods in which capital was actively at risk in the market, spotlighting the strategy’s selective nature and its focused engagement with the market.
Having commenced with an initial capital of $10,000, the strategy’s performance is a testament to the potential of seasonal trends. By the end of the period in 2023, the equity in the account had swelled to an impressive $82,613.69, with the peak equity reaching slightly higher at $84,006.51. These figures reflect a return of 726.14%, a substantial increase compared to the initial investment. For context, a traditional buy-and-hold approach during the same period would have yielded a return of 677.61%.
But what does this mean on an annualized basis? When we distill this growth down to an annual return, the strategy produced 22.92%. This annualization helps investors compare the performance of this strategy against other investment opportunities or benchmarks, providing a clearer picture of its efficacy over time.
This strategy’s results are particularly striking when contrasted with the broader market or alternative investment strategies. It’s an illustration of how a well-defined, systematic approach to trading, grounded in the cyclical nature of the stock market, can unearth opportunities for substantial growth. By dissecting the timing and duration of trades, investors can craft a strategy that not only seeks to capture gains but also to navigate the choppy waters of market seasonality with precision and confidence.
Key Performance Indicators
Investors often seek to measure the success of their trading strategies rigorously, and one such strategy that has garnered attention revolves around the seasonality patterns of Burlington Stores, Inc. The backtesting results of this intriguing strategy, which capitalizes on specific months for initiating long and short positions, have brought some illuminating insights to the fore.
Looking at the performance of this strategy from its inception in early October 2013 to the close of December 2023, we see a significant growth in the initial capital. The strategy turned a $10,000 investment into $82,613.69. This remarkable growth reflects a total return of 726.14%, an impressive figure that outpaces the 677.61% return from a simple buy-and-hold approach over the same period. When we annualize these returns, the strategy continues to impress, with an annualized return of 22.92% compared to the 22.41% annualized gain of the buy-and-hold method.
While these returns are certainly robust, they become even more compelling when we consider the exposure time to the market. The strategy was only active 34.35% of the time, minimizing time in the market and ostensibly reducing risk exposure. In comparison, a buy-and-hold strategy would have maintained a near-constant exposure, at 99.92%. This reduced market exposure is a key point for investors who appreciate capital growth without the need to be perpetually tied to market fluctuations.
At its pinnacle, the strategy’s equity peaked at $84,006.51, which is a testament to the effectiveness of the selected trading months. The equity peak, while a momentary high point, offers a glimpse into the potential of this trading approach during its most successful periods.
Risk Management
When evaluating any trading strategy, a crucial component to consider is how it manages risk. Risk management in trading refers to the identification, assessment, and prioritization of potential financial losses, and the application of resources to minimize, control, or mitigate the probability and/or impact of unfortunate events.
In the context of the monthly seasonality trading strategy for Burlington Stores, Inc. (BURL), we observe several indicators that provide insight into the level of risk associated with this approach. These indicators help us understand the fluctuations and potential downside investors might encounter.
Firstly, the annualized volatility of this strategy stands at 29.81%. Volatility is a statistical measure of the dispersion of returns for a given security or market index. In most cases, the higher the volatility, the riskier the security. This figure is particularly noteworthy when compared to the significantly higher annualized volatility of a buy-and-hold strategy in the same stock, which is 52.29%. The lower volatility of the seasonal trading strategy suggests a smoother investment ride compared to simply holding the stock throughout the same period.
The Sharpe Ratio of the seasonal trading strategy is 0.769, a metric that helps us understand the return of an investment compared to its risk. The higher the Sharpe Ratio, the better the risk-adjusted performance of the investment. In comparison, the buy-and-hold approach for BURL has a Sharpe Ratio of 0.429, indicating that the seasonal strategy provides a more favorable return for the risk taken.
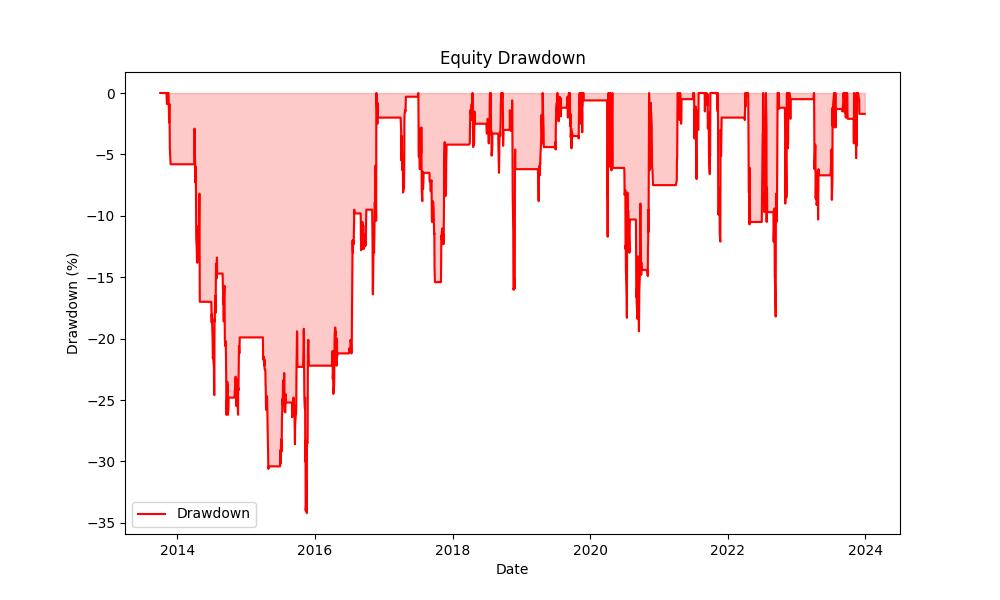
When we look at the maximum drawdown, which represents the largest peak-to-trough decline in the account value over the backtesting period, the strategy experienced a 34.21% drawdown. Although this may seem significant, it is considerably less traumatic than the 68.87% max drawdown seen in the buy-and-hold strategy. This suggests that the seasonal strategy shields investors from the more severe downturns that can occur with BURL stock.
Furthermore, the average drawdown, which is the average decline from a peak to a trough during a specific period of time, was -5.37% with an average duration of 68 days for the seasonal strategy. This provides a context for how often and how long investors might expect to see their investment below its peak value.
Lastly, the Max Drawdown Duration, which is how long it took for the investment to recover from the largest drawdown, was a concerning 1103 days for the seasonal trading strategy. This implies that at one point, investors would have to wait approximately three years for the strategy to recover from its largest loss. However, it’s important to contextualize this with the buy-and-hold strategy, which not only had a deeper drawdown but also a Max Drawdown Duration of 870 days.
These risk management indicators give us a comprehensive view of the potential downsides and the stability of returns for the monthly seasonality trading strategy applied to Burlington Stores, Inc. (BURL). They reveal that while there are risks involved, as with any investment, the seasonal strategy appears to mitigate those risks better than a passive buy-and-hold approach. This can offer a more palatable investment experience for those who are willing to apply a more active management style to their portfolio.
Trade Analysis
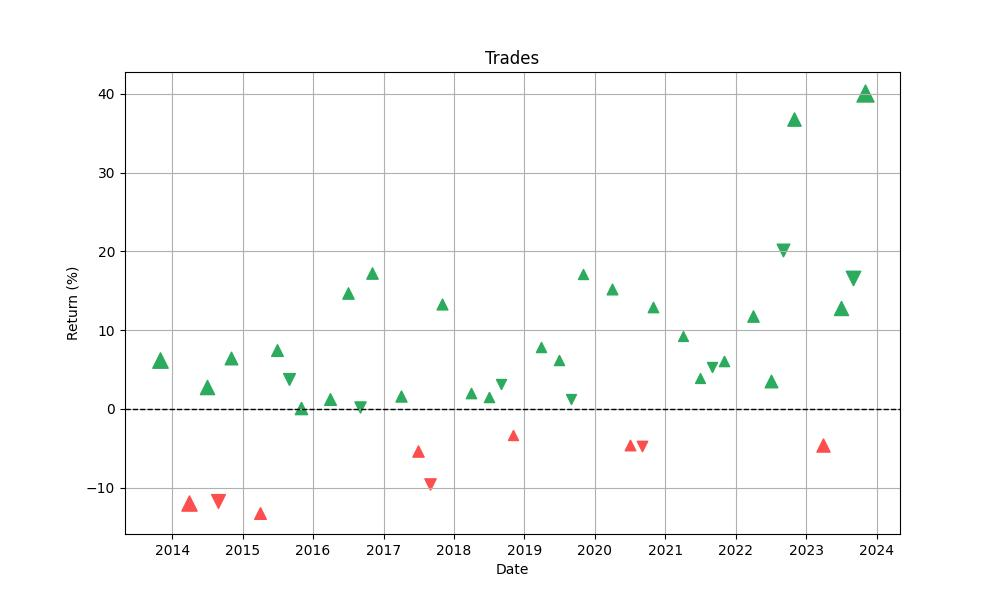
Delving into the heart of our trading strategy’s performance, we meticulously analyzed the data from 41 executed trades over a span of nearly a decade. This subset of trades, exclusively enacted during the specified months, shines a light on the robustness and reliability of our seasonal approach.
Impressively, the strategy boasted a win rate of approximately 78%, a testament to the efficacy of our methodical selection of trading months. This high success rate emphasizes the strategy’s potential to capitalize on Burlington Stores, Inc.’s historical price movements during these periods.
The trade outcomes themselves present a picture of strong potential gains, with the best trade surging to an exhilarating 40.12% return. In contrast, the strategy was resilient in the face of adversity, with the worst trade limited to a -13.21% loss. Such a comparison underscores the importance of timing in the stock market, where even a well-researched strategy can experience fluctuations.
On average, each trade generated a 5.30% return, illustrating a consistent performance across trades. Furthermore, the trades were typically brief engagements with the market, with the maximum duration of a single trade spanning 33 days and the average hovering around 31 days. This swift turnover implies a strategy that seeks to capitalize on short-term seasonal trends rather than long-term market shifts.
The Profit Factor, a ratio used to gauge a strategy’s profitability, stood at an impressive 4.48. This number indicates that the gross profits from winning trades were more than four times greater than the gross losses from losing trades, offering a buffer against potential downturns and highlighting the strategy’s potential for positive returns.
Expectancy, which measures the average expected return on each trade, was positive at 5.86%. This metric reinforces the notion that, over time, each trade adds incremental value to the portfolio, building a compelling case for the strategy’s effectiveness.
Such analytical insights into the strategy’s trade performance are crucial for retail investors. They provide a clearer understanding of what one can expect when adopting a seasonal trading approach with Burlington Stores, Inc. By examining these facets, investors can gauge the merits of the strategy and consider how it aligns with their risk tolerance and investment goals.
Conclusion
In conclusion, our exploration of the monthly seasonality trading strategy for Burlington Stores, Inc. (BURL) over the past decade has illuminated a path to potential profitability that leverages the cyclical nature of the stock market. The backtested results have exhibited not just a substantial return on investment but also a thoughtful approach to market exposure and risk management. While navigating the stock market’s intricacies can often seem daunting, this strategy’s performance indicates that with careful analysis and a strategic eye on seasonal trends, investors can indeed unearth opportunities for significant growth.
The strategy’s reduced market exposure, lower annualized volatility, and favorable risk-adjusted returns, as evidenced by its Sharpe Ratio and drawdown metrics, demonstrate a judicious balance of risk and reward. This balance is further underscored by the strategy’s high win rate and robust Profit Factor, lending confidence to the potential consistency of positive outcomes.
Nonetheless, it is imperative to acknowledge the inherent risks and the patience required, as indicated by the Max Drawdown Duration. Investments can undergo periods of decline, and a strategy such as this is no exception; however, the seasonal approach has shown resilience by outperforming a simple buy-and-hold strategy, even accounting for recovery periods.
Ultimately, this strategy’s success is a compelling case for the power of seasonal trading strategies when applied with precision. It offers a blueprint for investors willing to employ a more active management style, one that respects the rhythms of the market and seeks to align investment actions with historical performance trends. As with all investment strategies, individual investors must consider their unique financial situation, investment objectives, and risk appetite before embarking on such a strategic journey. But for those who do choose to engage with the market’s seasonality, the rewards, as we’ve seen, can be substantial and well worth the endeavor.

“Make the invisible visible. My goal is to shine a light on the subtle seasonal signals in the stock market, providing investors with the insight needed to make informed decisions. By breaking down the complexities of seasonality, I strive to empower our audience with knowledge and foresight, turning data into action.”