Introduction
Welcome to the intricate dance of market seasonality, where time-tested patterns whisper the secrets of potential investment success. As the seasons change, so too do the rhythms of the stock market, offering a unique cadence to those tuned into its subtle fluctuations. The focus of our exploration is a titan of industry and a staple of the American economy: The Coca-Cola Company (KO). This beacon of consumer loyalty and financial resilience serves as the perfect subject to illustrate the power of a well-crafted seasonal trading strategy.
In this blog post, we dive deep into the mechanics of a strategy that seeks to harness the recurring patterns of Coca-Cola’s stock performance throughout the year. By meticulously analyzing historical data, we have identified specific months that have repeatedly provided fertile ground for investment opportunities. Our approach is not one of constant market presence but of strategic, calculated engagements that aim to optimize the intersection of timing and market dynamics.
Join us as we navigate the ebb and flow of Coca-Cola’s stock, armed with a strategy that has been carefully backtested to demonstrate its potential efficacy. As we unravel the complexities of monthly seasonality, you’ll discover how a disciplined approach to stock market timing can lead to impressive growth, outpacing even the steadfast buy-and-hold method. Through our journey, we will shed light on key performance indicators, delve into risk management, and scrutinize trade outcomes to provide a comprehensive understanding of this dynamic seasonal trading strategy.
Company Overview
The Coca-Cola Company (KO), a global beverage giant, has captivated consumers worldwide with its iconic beverages for over a century. With its headquarters in Atlanta, Georgia, KO operates in over 200 countries and boasts a diverse portfolio of sparkling soft drinks, still beverages, water, enhanced water, juices, dairy, plant-based beverages, teas, coffees, and energy drinks. KO’s target market encompasses individuals of all ages, and its revenue streams stem from product sales, concentrate sales, and strategic alliances. The company’s value proposition lies in its ability to deliver refreshing beverages that have become an integral part of global culture. KO’s operational model revolves around a vast network of bottling partners, ensuring efficient distribution and localized production. Its growth strategy is bolstered by innovation, expansion into emerging markets, and strategic partnerships. The industry analysis reveals that KO operates in a highly competitive beverage industry, characterized by intense competition, changing consumer preferences, and regulatory challenges. Despite these, KO’s brand recognition, extensive distribution network, and commitment to quality have fortified its position as a leading player in the industry.
Strategy Overview
Embarking on a journey through the labyrinthine world of stock market seasonality, we uncover the intricate patterns that govern the ebb and flow of trading opportunities. Today, we hone in on The Coca-Cola Company (Symbol: KO), an emblem of long-standing financial stability and consumer loyalty, to dissect a trading strategy that leverages the cyclical nature of the markets, specifically targeting certain months where historical patterns suggest a potential edge for the astute investor.
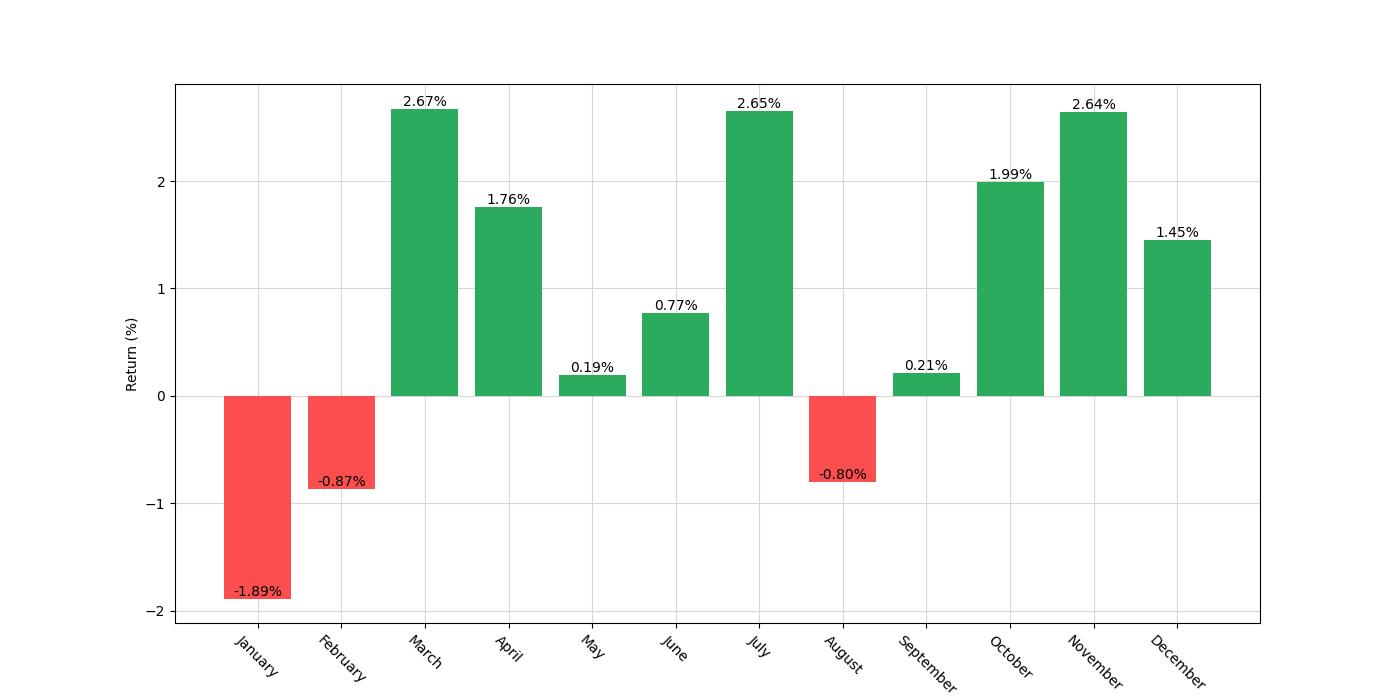
At the heart of this strategy lies the principle of monthly seasonality. The hypothesis is that certain months tend to exhibit consistent performance trends for Coca-Cola’s stock. This strategy, therefore, involves initiating a long position—buying with the expectation that the stock price will rise—in the months of March, April, October, and November. Conversely, it calls for a short position—selling with the expectation of buying back at a lower price—in the month of January.
Our backtesting parameters are defined by an initial capital of $10,000, with the strategy spanning from January 2, 2004, to December 29, 2023, marking a duration of 7,301 days. It’s crucial to note that during this backtested period, the exposure time to the market—effectively the periods when the strategy was actively engaged in either a long or short position—was 34.61% of the total duration. This relatively selective market engagement underscores the strategy’s focus on capitalizing on specific temporal opportunities rather than maintaining constant market exposure.
This rigorous backtest did not account for commissions or slippage, presenting a more idealized scenario. Slippage refers to the difference between the expected price of a trade and the price at which the trade is actually executed, which can be caused by market volatility or delays in execution. By not including these factors, the results showcase the gross performance of the strategy, unencumbered by these real-world trading frictions.
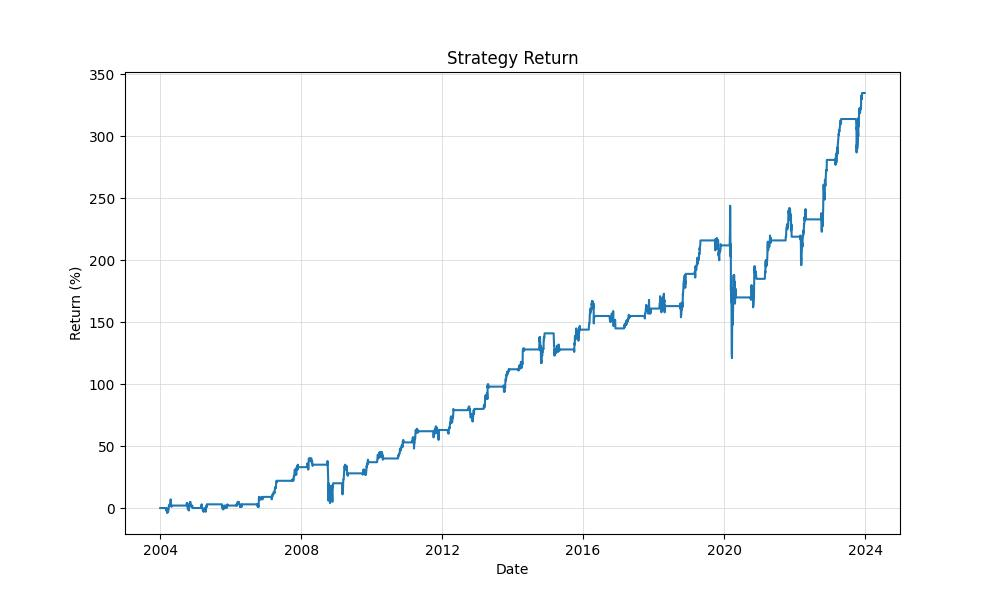
The fruits of this approach are evident in the numbers. The equity at the end of the backtest period stood at $43,525.10, reaching the same peak during the testing phase. When we talk about equity in this context, we’re referring to the total value of the trading account after the last trade has been closed. This represents a remarkable growth of 335.25% on the initial capital. To put this into perspective, a passive buy-and-hold strategy over the same period would have yielded a return of 324.81%. While both strategies performed admirably, the disciplined execution of our seasonality strategy slightly edges out the passive approach, demonstrating the value of strategic market timing.
A further dimension of performance is the annualized return, which standardizes returns to a yearly metric for comparability. The seasonal trading strategy delivered a 7.64% annualized return, affirming its consistent performance over nearly two decades. This consistency is the lifeblood of the strategy, providing investors with a steady compass through the tumultuous seas of market volatility.
Key Performance Indicators
Navigating the ebb and flow of the stock market can be akin to a captain steering through the changing tides of the sea. Seasonality strategies offer a compass for investors, guiding them through historical patterns that can illuminate potential future performance. The Coca-Cola Company, a beverage behemoth known for its flagship product, Coca-Cola, along with a diverse portfolio of over 500 brands, serves as our vessel for exploring the impact of such a strategy.
Embarking on this journey from the start of 2004 to the end of 2023—a span of 7301 days—our trading strategy unfurled its sails selectively, catching the winds during March, April, October, and November, and anchoring down in January. This methodical approach meant our market exposure was limited to approximately 34.61% of the time, compared to a constant exposure one would experience with a buy-and-hold strategy.
Upon returning to dock, our initial investment of $10,000 burgeoned to an impressive $43,525.10, peaking at the same amount, which is indicative of a strategy that avoided significant downturns right before the end date of the backtest. This represents a cumulative return of 335.25%, edging out the traditional buy-and-hold approach’s return of 324.81%. When we adjust these returns to an annual scale, the strategy still maintains its lead with a 7.64% annualized return against the buy-and-hold’s 7.48%.
Investing, however, is not just about the returns—it’s also about the journey. Volatility, akin to the choppiness of the sea, was markedly lower for our seasonality strategy, which encountered annualized volatility of 13.32% compared to the rougher waters of the buy-and-hold’s 19.85%. This smoother voyage results in a Sharpe Ratio of 0.57 for our strategy, suggesting that each unit of risk taken was rewarded more efficiently compared to the 0.38 Sharpe Ratio of the buy-and-hold.
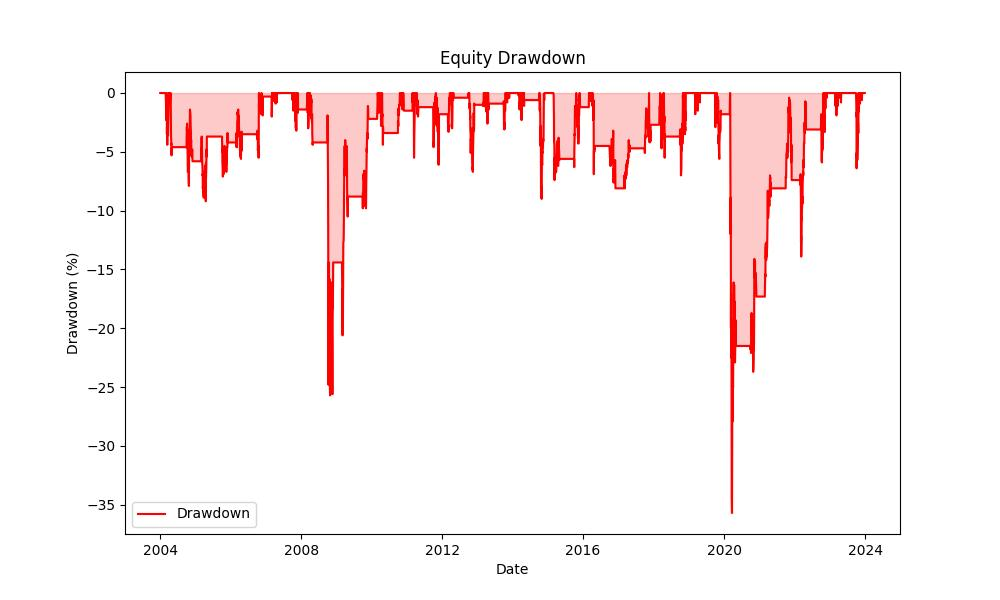
Risk, akin to the treacherous weather at sea, is an unavoidable companion on this voyage. The strategy weathered a maximum drawdown—a measure of the largest drop from peak to trough—of 35.71%, which is slightly better than buy-and-hold’s 40.61%. Perhaps more telling is the average drawdown—akin to the average storm intensity—which was a milder -2.23% for our strategy, compared to a more severe -3.44% for buy-and-hold. The duration of these drawdowns is also worth noting, like the length of a storm, with our strategy facing adverse conditions for an average of 55 days, showcasing its resilience in comparison to the buy-and-hold’s 59 days.
These key performance indicators tell a tale of a strategy that not only outperformed in terms of total return but also offered a smoother sail with less time spent in rough waters. It is a narrative of prudent market engagement, where understanding and leveraging historical patterns can steer investors toward more favorable horizons.
Risk Management
When considering any trading strategy, it is paramount to assess the risks involved to ensure that your investment decisions are well-informed. Our analysis of the Coca-Cola Company’s monthly seasonality trading strategy reveals critical insights into its risk profile.
Diving into the annualized volatility, which measures the degree of variation in trading prices over time, we see a rate of 13.32%. This suggests a moderate level of price fluctuations, which can be favorable for investors who are averse to high volatility. In comparison to the buy and hold approach, which has a higher annualized volatility of 19.85%, our seasonal strategy appears to be less erratic, providing a smoother investment ride.
The Sharpe Ratio, a tool to understand the return of an investment compared to its risk, stands at 0.574 for our strategy. This is significantly higher than the buy and hold Sharpe Ratio of 0.377, indicating that each unit of risk taken in the seasonal strategy has resulted in a better return compared to the passive strategy. As a rule of thumb, a Sharpe Ratio greater than 1 is excellent, between 0.5 to 1 is acceptable, and below 0.5 may need reassessment. While our strategy does not hit the ‘excellent’ mark, it remains within the ‘acceptable’ range.
Max Drawdown, which is the peak-to-trough decline during a specific record period of an investment, is a critical metric for measuring the largest potential loss. Our strategy experienced a Max Drawdown of 35.71%, which is noteworthy but not as severe as the 40.61% seen in the buy and hold scenario. This suggests that while both strategies have their risks, the seasonal approach has historically weathered market downturns slightly better.
The Average Drawdown of -2.23% encountered in the strategy provides a sense of the typical dips one might expect during the investment period. It’s smaller in magnitude compared to the buy and hold average drawdown of -3.44%, supporting the notion that the strategy generally maintains a tighter control on losses.
Furthermore, the Max Drawdown Duration, which is the longest time an investment has taken to recover from a peak to a trough, was 965 days for our seasonal strategy. Although this is quite a stretch of time, it is shorter than the 1080 days observed in the buy and hold approach. Alongside, the Average Drawdown Duration for our strategy is 55 days, indicating that most drawdowns are relatively short-lived.
In sum, the risk metrics associated with our trading strategy suggest a balance between risk and return that may appeal to investors looking for a more stable investment approach compared to the traditional buy and hold strategy. By engaging with our seasonal strategy, investors potentially benefit from lower volatility and shorter periods of drawdown, contributing to a more controlled investment experience.
Trade Analysis
Diving into the nitty-gritty of trading strategy performance, one of the most compelling aspects to consider is the actual results when the strategy is put into action. When we apply our focus to The Coca-Cola Company (KO) and assess the monthly seasonality trading strategy, we unearth some fascinating insights.
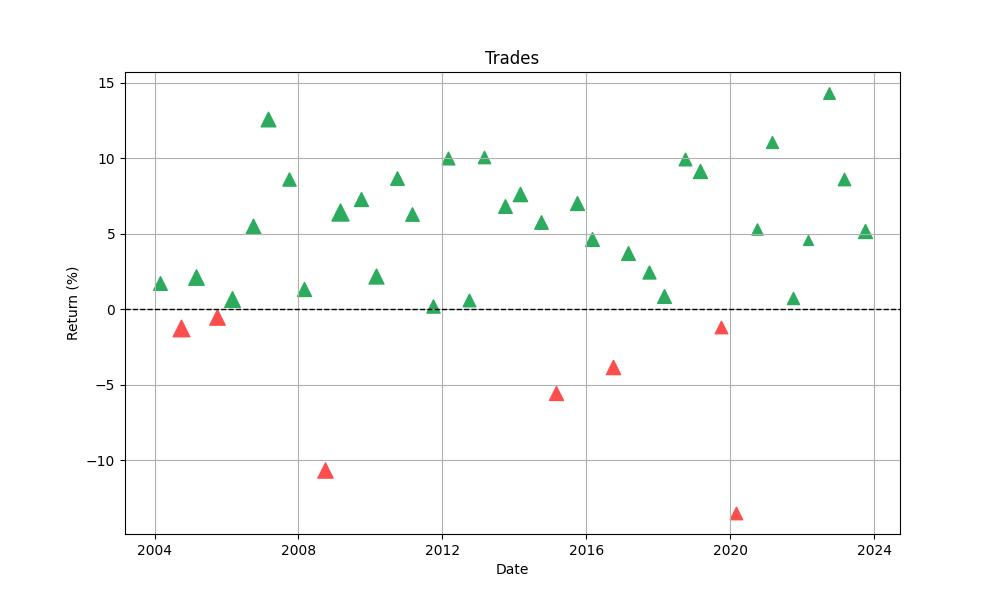
The strategy in question has participated in a total of 40 trades over the tested period. This figure may seem modest at a glance, yet it’s the efficacy of these trades that truly captures our attention. An impressive win rate of 82.5% emerges from the data, indicating that more than four out of every five trades have been profitable. Such a high success rate is quite noteworthy and suggests a level of consistency that can be comforting for investors who value reliability in their trading approaches.
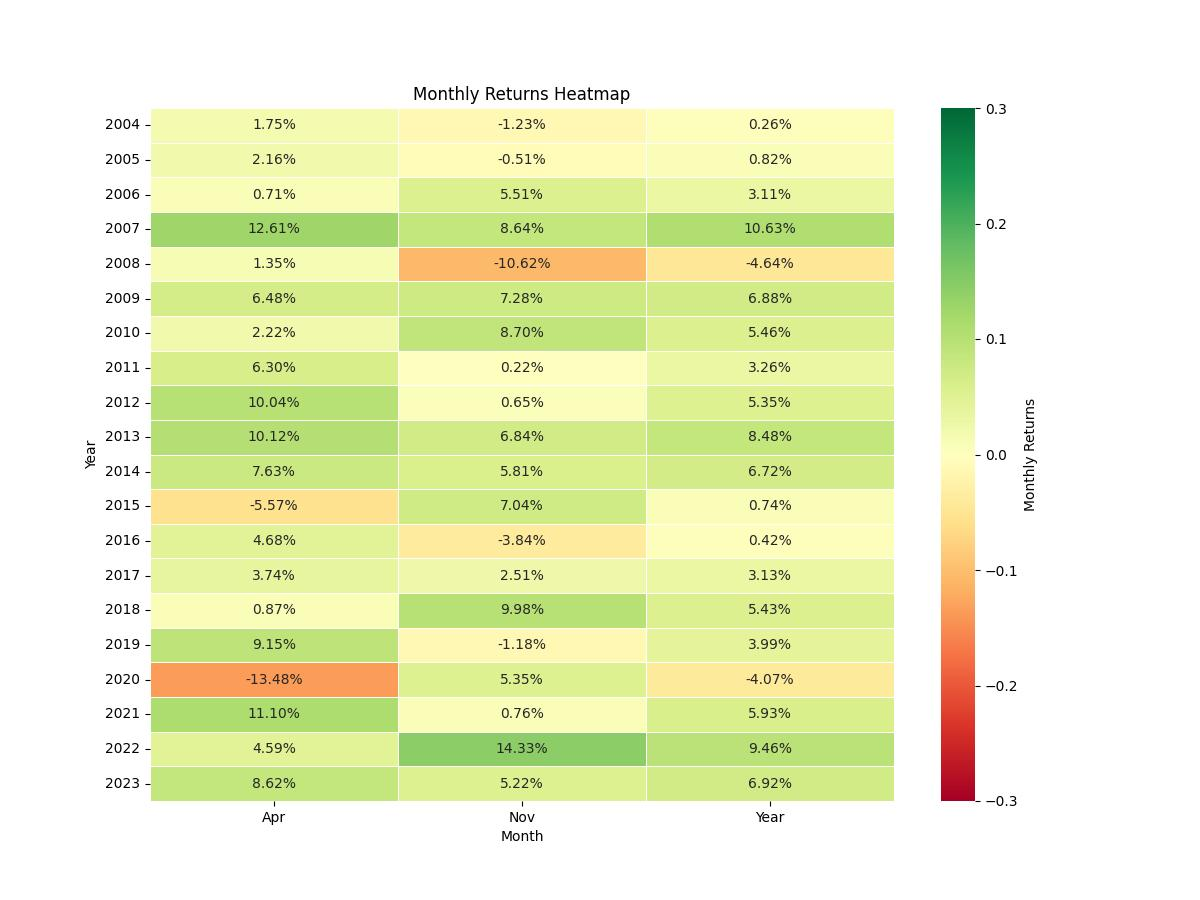
The individual trade outcomes further illuminate the strategy’s performance. The best trade yielded a remarkable gain of 14.33%, a figure that highlights the potential for significant returns within certain months. On the flip side, even the most robust strategies face setbacks, and this one is no exception. The worst trade reported a loss of 13.48%, reminding us of the inherent risks in stock market trading.
However, it’s not just about the extremes. The average trade, sitting comfortably at a 3.75% return, provides a more holistic view of what an investor might typically expect from this strategy. While the single best and worst trades are important data points, the average trade figure helps set a more realistic expectation for performance.
In examining the duration of these trades, we find that they typically align with the monthly cadence of the strategy. The average trade duration mirrors the calendar month, clocking in at roughly 62 days, with the longest trade not exceeding a 63-day time frame. This consistency in duration fortifies the predictability of the strategy, allowing investors to plan their market exposure with a higher degree of certainty.
One of the most striking figures emanating from this analysis is the profit factor, which stands at a robust 5.30. This metric, which divides the total gains by the total losses, serves as a testament to the profitability of the strategy. A profit factor greater than one indicates a winning strategy, and at over five, the results suggest a strong performance.
Moreover, the expectancy of 3.91% provides further insight. This number represents the average amount one can expect to win (or lose) per trade after factoring in the probability and scale of gains and losses. A positive expectancy is a beacon of potential profitability, and in this context, it adds another layer of attractiveness to the strategy.
Lastly, the System Quality Number (SQN), which measures the strategy’s risk-adjusted performance, comes in at an impressive 3.58. This number categorizes the strategy as excellent, providing yet another datapoint that supports its robustness.
In sum, this backtested monthly seasonality trading strategy for The Coca-Cola Company has demonstrated significant potential for investors. With a high win rate, respectable average gains, and a strong profit factor, it paints a picture of a strategy that could be a valuable component of a seasonality-focused investor’s playbook.
Conclusion
In conclusion, our exploration into the seasonality of The Coca-Cola Company’s stock reveals a compelling narrative of strategic timing and prudent risk management. The backtested data provides a beacon of insight, highlighting a strategy that not only outpaces the traditional buy-and-hold approach in terms of total return but also offers a smoother investment experience with lower volatility and shorter drawdown periods.
The strategy’s selective market engagement, based on historical monthly performance trends, has borne fruit in the form of a 335.25% cumulative return over nearly two decades. This, paired with a 7.64% annualized return, underscores the potential of seasonal trading strategies to deliver consistent and robust performance.
The risk metrics reinforce the strategy’s merit, presenting an acceptable balance between risk and reward, as evidenced by a moderate level of volatility and a Sharpe Ratio that falls within the ‘acceptable’ range. Our strategy has shown resilience against market downturns, with a Max Drawdown and Average Drawdown that are both lower than those of a buy-and-hold strategy, and with drawdown durations that suggest a quicker recovery from market dips.
Furthermore, the trade analysis accentuates the strategy’s reliability, with an impressive win rate of 82.5% and a profit factor that signifies strong profitability. The average trade return and the expectancy further bolster confidence in the strategy’s potential for success.
Investors who are intrigued by the rhythm of the markets and the opportunities presented by seasonality may find this strategy to be a valuable addition to their investment arsenal. It emphasizes the importance of timing, risk consideration, and the power of historical patterns, offering a comprehensive approach to navigating the seasonal currents of the stock market.
As with any investment strategy, it is essential for investors to conduct their own due diligence and consider their individual risk tolerance. However, the results of this backtested strategy suggest that, for those willing to embrace the seasonality of the markets, there may be bountiful harvests to be reaped in the rhythmic cycles of trading.

“Make the invisible visible. My goal is to shine a light on the subtle seasonal signals in the stock market, providing investors with the insight needed to make informed decisions. By breaking down the complexities of seasonality, I strive to empower our audience with knowledge and foresight, turning data into action.”

