


Introduction
As the leaves change and the days grow shorter, investors often ponder the cyclical nature of the stock market, seeking out patterns and strategies that could lead to financial harvests. The concept of seasonality in stock trading is not just an old traders’ tale; it’s a phenomenon backed by data and leveraged by those in the know to potentially gain an investment edge.
In this deep dive, we’ll be exploring how the changing seasons can influence the performance of stocks, focusing on a case study of General Motors Company—a giant in the automotive sector—and a trading strategy that turns the calendar into a tool for market navigation. We’ll unravel the complexities of seasonal trends, translating sophisticated market analysis into actionable insights, including the best times to initiate long or short positions based on historical monthly patterns.
Whether you’re a seasoned investor or new to the trading scene, understanding the seasonality of the stock market can be a game-changer, offering a new perspective on how to optimize your investment strategies. Join us as we chart the course through the fiscal seasons, shedding light on how the time of year can affect stock performance and how you can potentially capitalize on these patterns to steer your portfolio toward calmer waters and brighter financial futures.
Company Overview
General Motors (GM) is an automotive giant with a rich history and a global presence. The company designs, manufactures, and sells a wide range of vehicles, including cars, trucks, and SUVs, under various brands such as Chevrolet, Buick, GMC, and Cadillac. GM’s target market encompasses a diverse range of consumers, from budget-conscious buyers to luxury car enthusiasts. The company generates revenue through the sale of vehicles, as well as financing, insurance, and other automotive services. GM’s value proposition lies in its commitment to innovation, quality, and customer satisfaction. The company operates an extensive network of manufacturing facilities and dealerships worldwide, enabling it to efficiently produce and distribute its vehicles. GM’s growth strategy involves expanding into new markets, developing electric and autonomous vehicles, and leveraging its strong brand portfolio. The automotive industry is highly competitive, characterized by technological advancements, changing consumer preferences, and regulatory pressures. Despite these challenges, GM’s strong financial position, experienced management team, and commitment to innovation position it well for continued success in the global automotive market.
Strategy Overview
In the quest to demystify the financial markets, savvy investors often turn to various trading strategies, one of which is the intriguing concept of monthly seasonality. Here, we delve into a practical application of this strategy, specifically tailored for General Motors Company, a stalwart in the automotive industry.
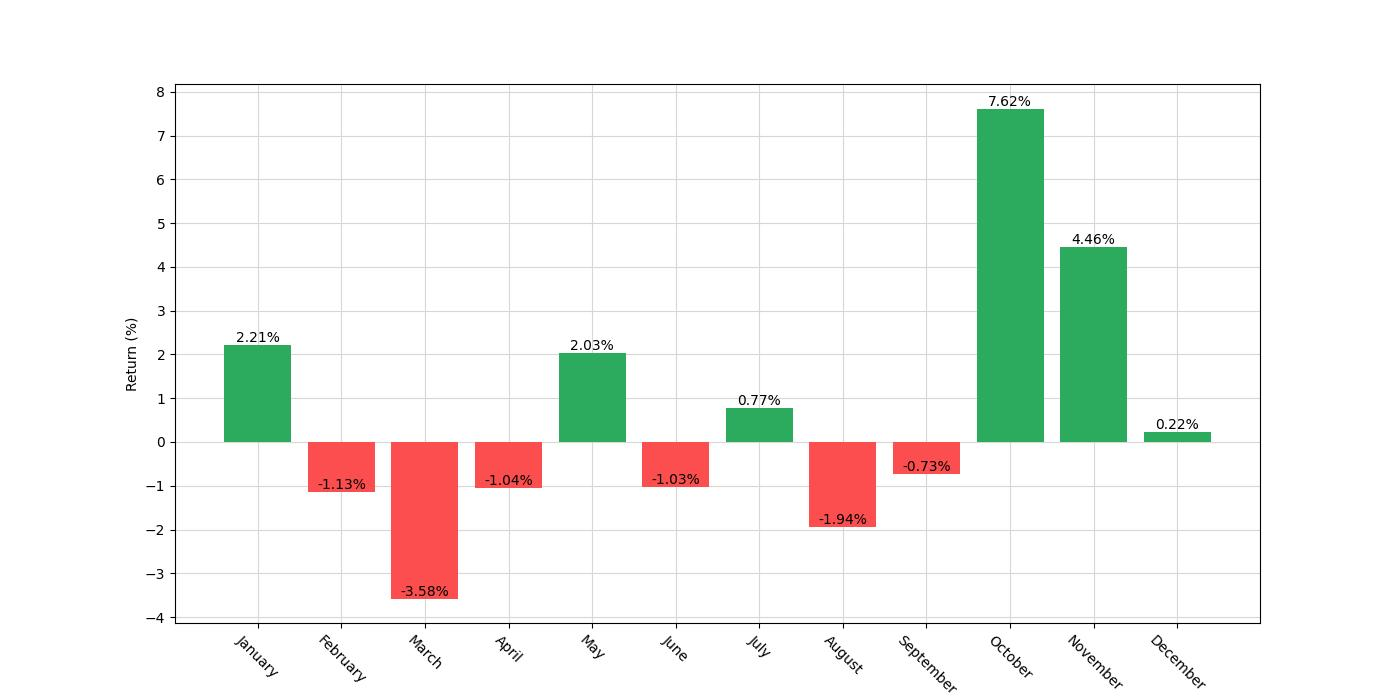
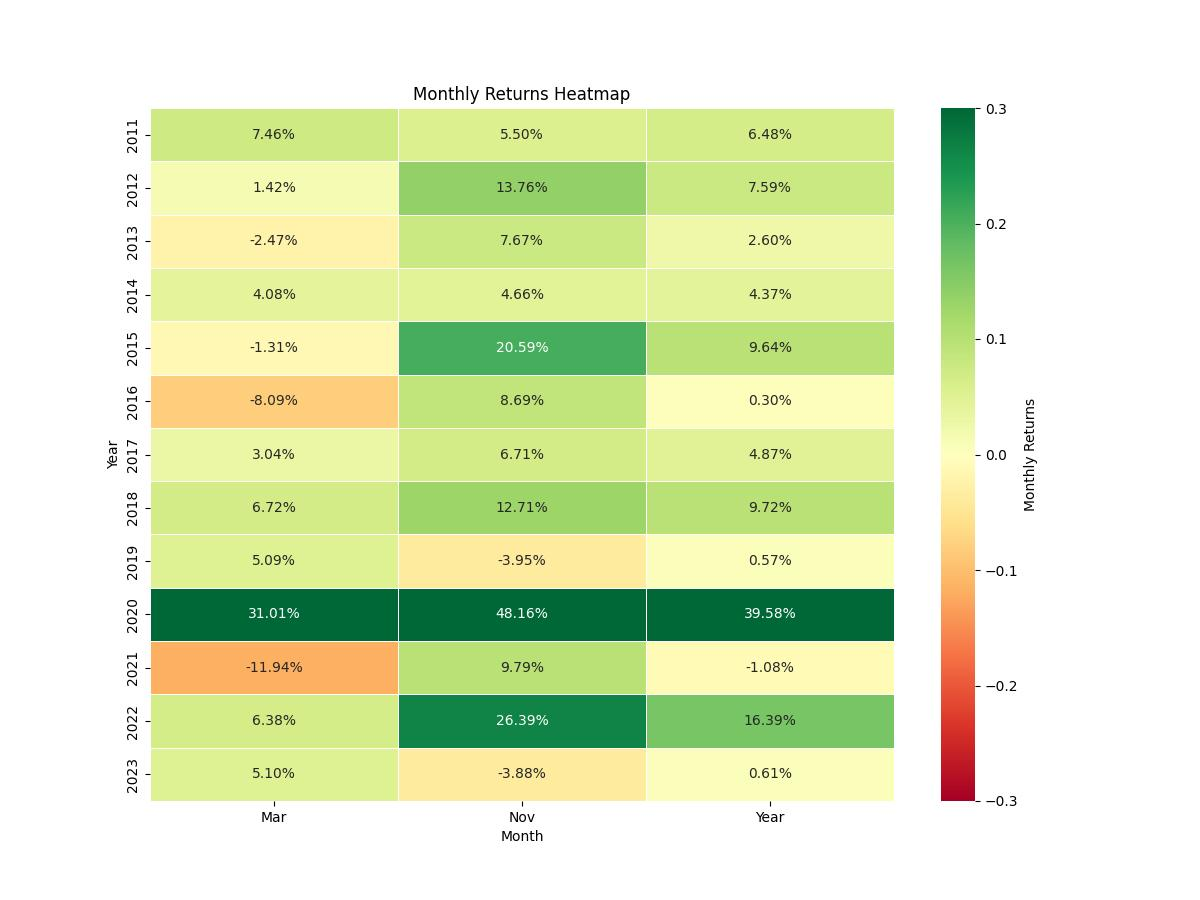
The essence of the strategy is elegantly simple yet hinges on historical patterns. The approach dictates initiating a long position in the stock of General Motors during the months of October and November. Conversely, a short position is adopted for the month of March. This cyclic strategy is predicated on the notion that certain months can exhibit consistent performance trends over time, whether bullish or bearish for the stock in question.
This backtested strategy spans a significant timeframe, commencing on November 18, 2010, and drawing to a close on December 29, 2023, encapsulating a total of 4789 days of market activity. It’s worth noting that the exposure time — the proportion of the period when the strategy was actively engaged in the market — was approximately 26.18%. This relatively selective market participation is a hallmark of a seasonal strategy, which intentionally avoids a continuous market presence in favor of exploiting anticipated temporal trends.
With an initial capital investment of $10,000, this approach navigated through the tapestry of market conditions without the encumbrance of commissions or the consideration of slippage, offering a purer view of the strategy’s theoretical potential.
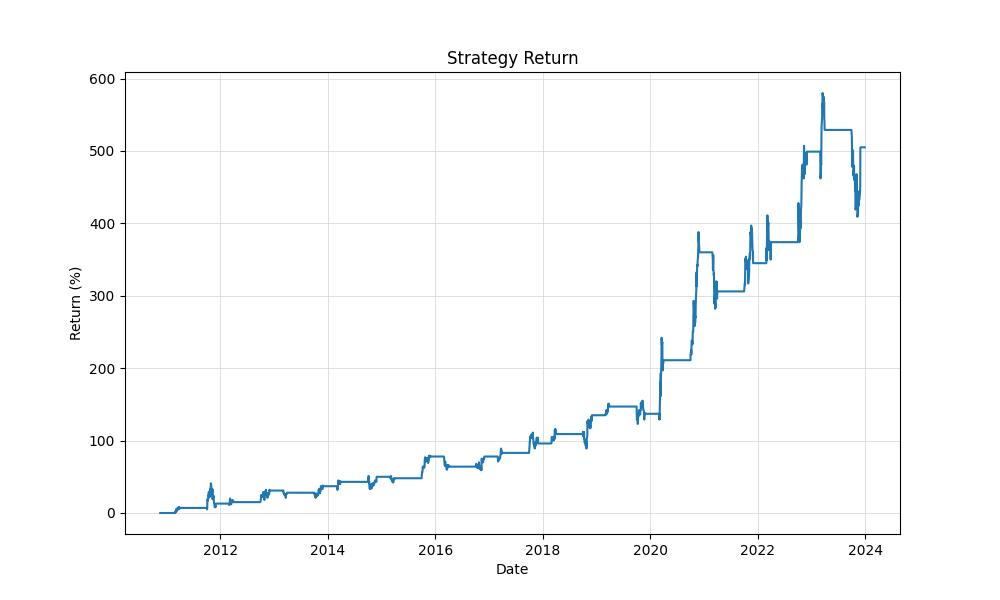
The results of the backtest paint a compelling picture. The final equity, standing at $60,467.75, markedly surpasses the initial stake, while the peak equity reached an even more impressive $68,018.43. These figures translate into a return of over 504.67%, dwarfing the buy & hold return of 37.96% for the same period. Moreover, when annualized, the strategy’s return stands at 14.73%, a robust performance indicator, especially when contrasted with the annualized buy & hold return of 2.53%.
Investors often seek strategies that offer superior returns without significantly amplifying risk. Here, the evidenced exposure time suggests that the strategy’s market interactions are both calculated and contained, potentially offering a buffer against the broader market’s volatility and systemic risks. However, the true efficacy of any strategy is revealed not in isolation but through a comparative lens, especially against a strategy as universally accepted as buy & hold.
This seasonal strategy’s performance is not merely a matter of gross returns but also of the efficiency and effectiveness within the context of the market’s temporal rhythms. It stands as a testament to the potential of targeted, time-specific market engagement. For the retail investor, understanding and potentially harnessing such seasonal tendencies could provide a strategic edge in the ongoing quest to achieve investment success.
Key Performance Indicators
Navigating the stock market can often resemble embarking on a voyage through the seasons, where understanding the climate is crucial for a successful journey. For investors in General Motors Company, a titan in the automotive industry, harnessing the power of seasonal trends could be the wind in their sails. Let’s delve into the performance of a seasonality-based trading strategy that capitalizes on these cyclical patterns.
The trading strategy in question zeroes in on two specific times of the year: a long position is initiated during the months of October and November, while a short position is taken in March. This approach is based on historical data suggesting that these periods contain distinct patterns that can be exploited for potential gains.
From its inception on November 18th, 2010, until the end of the data on December 29th, 2023, this strategy displayed remarkable results when compared to a simple buy-and-hold approach. With an initial investment of $10,000, the strategy managed to grow this capital to an impressive $60,467.75, which stands in stark contrast to the $13,872.37 final equity achieved by the buy-and-hold method over the same period. This represents a monumental return of over 504%, dwarfing the buy-and-hold return of nearly 38%.
When we adjust these figures to account for the annualized return, the trading strategy still shines with an annual return of approximately 14.73%. This rate of return is not just a flash in the pan; it is over five times higher than the buy-and-hold annualized return of around 2.53%. Such a stark difference underlines the potential benefits of employing a targeted trading strategy based on seasonal market behavior.
At the zenith of its performance, the strategy’s equity peaked at $68,018.43, which further underscores the effectiveness of the seasonal approach. This peak equity is a beacon, illuminating the path to what can be achieved when an investor sails the market currents with a keen eye on the calendar.
It’s important to remember that while returns can be dazzling, they don’t come without their share of risks. However, in this context, the strategy’s risk-adjusted return, as measured by the Sharpe ratio, was a respectable 0.69, suggesting that the excess return over the risk-free rate was achieved with a reasonable level of risk.
In the end, these figures tell a compelling story: by understanding and leveraging the seasonality of the stock market, investors can potentially enhance their returns significantly. The journey of General Motors Company’s stock through the seasons, when navigated with a well-defined strategy, has proven to be a prosperous one for those who embarked upon it.
Risk Management
In the intricate dance of stock market investing, risk is a partner that cannot be ignored. It’s essential for investors to understand the ebb and flow of risk as they navigate through their trading strategies. When it comes to the monthly seasonality trading strategy applied to General Motors Company (GM), there are several risk-related metrics that deserve attention.
Let’s start with the annual volatility, which stood at approximately 21.31%. This figure might seem daunting, as it indicates the degree to which GM’s stock price deviated from its average over the given period. However, it’s important to contextualize this number within the nature of the strategy itself. Since the strategy involves going long in certain months and short in others, it’s expected that we would see a higher level of price fluctuation compared to a more passive investment approach.
The Sharpe Ratio, a tool used to understand the return of an investment compared to its risk, is 0.691 for this trading strategy. While a Sharpe Ratio greater than 1 is generally considered excellent, a ratio under 1 doesn’t necessarily spell doom. It suggests that the excess return of the strategy over the risk-free rate is not as high as one might ideally want, but it is still positive, indicating that the strategy has been able to generate returns that compensate for the taken risks, albeit not excessively.
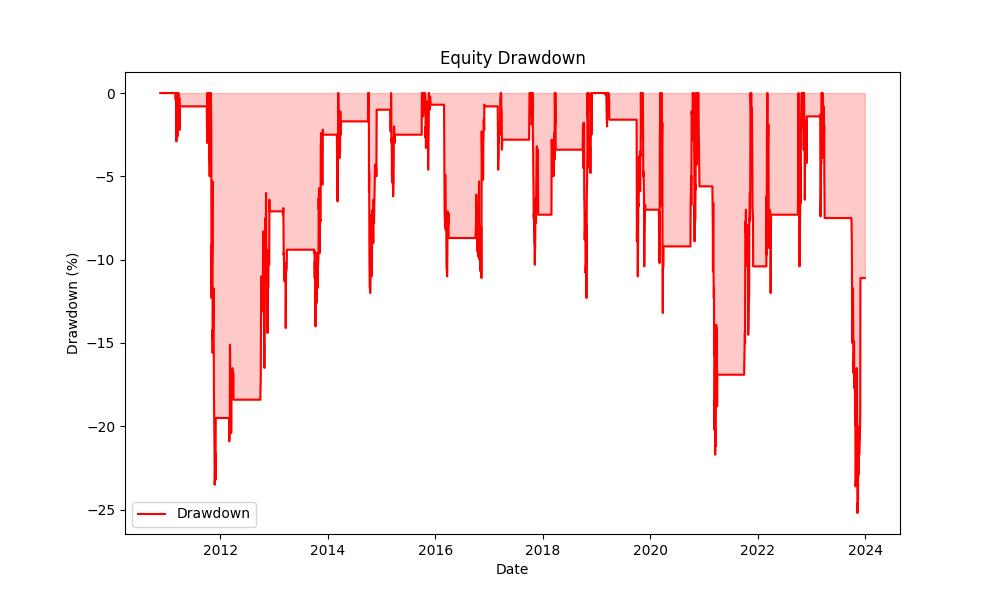
When assessing the risk of a trading strategy, one must always consider the Maximum Drawdown, which in this case was -25.24%. This is the largest observed loss from a peak to a trough of a portfolio, before a new peak is attained. It’s a crucial metric because it gives an investor an idea of the potential losses they might face. The Average Drawdown was around -5.50%, and both these figures tell investors that while the strategy has seen its fair share of dips, they have been relatively contained compared to the possible gains.
Moreover, the duration of these drawdowns helps us gauge the resilience of the strategy. The longest drawdown persisted for 865 days, whereas the average drawdown lasted 89 days. These durations are significant because they give insight into the recovery time from losses, and in this case, they suggest that while the investor may need to be prepared for the long haul in some scenarios, typically the strategy recovers in a shorter timeframe.
It’s also worth noting that while the figures above provide a snapshot of the historical risk, they do not account for the psychological toll a drawdown can have on an investor. Watching one’s investment value decrease for days, even if recovery is expected, can be a challenging experience, and it’s vital for investors to consider their own risk tolerance when engaging with any trading strategy.
Trade Analysis
In the ever-fluctuating world of the stock market, strategic trading based on historical seasonal patterns can be a compelling approach. The performance of General Motors Company (GM) under the lens of a specified monthly seasonality strategy offers insights into the potential of such an approach.
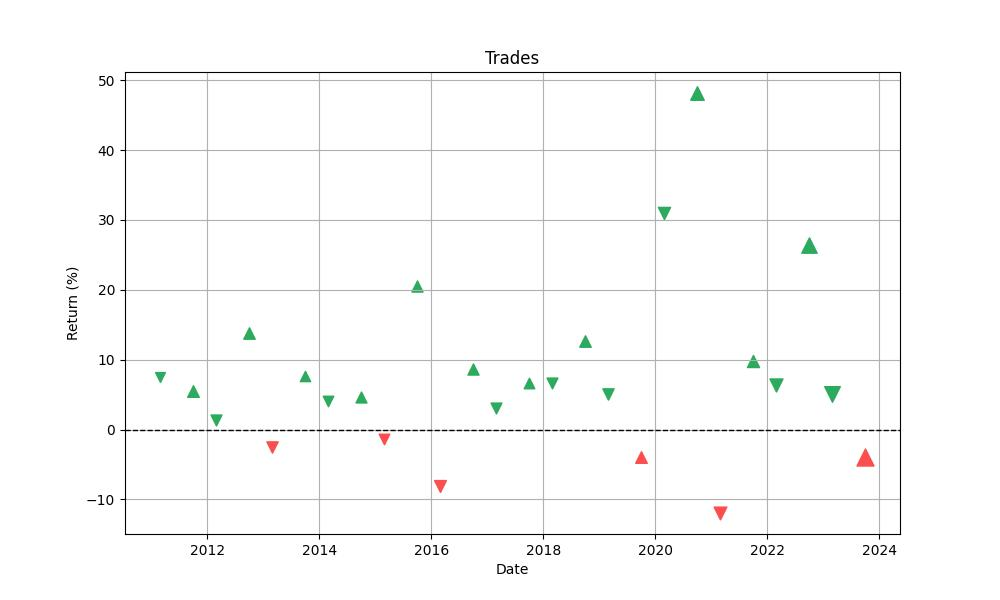
With a total of 26 trades executed over the backtesting period, the strategy demonstrates a robust win rate of approximately 76.92%. This figure alone underscores the strategy’s efficacy, suggesting that three out of four trades, on average, resulted in a positive outcome—a reassuring statistic for investors considering a similar trading approach.
Delving deeper into the nature of these trades, we find that the best trade yielded a staggering 48.16% return. This exceptional peak hints at the potential windfalls that can be achieved during optimal market conditions when the seasonal strategy aligns perfectly with market movements.
On the other end of the spectrum, the strategy’s worst trade saw a decline of 11.94%. While losses are an inevitable part of trading, the relatively modest size of the worst loss, compared to the magnitude of the best gain, provides a sense of the controlled risk that the strategy maintains.
The average outcome of a trade stands at 7.17%, which is substantial when considering the investment horizon. This average is bolstered by the strategy’s significant profit factor of 7.425, a ratio that compares the total gains from winning trades to the total losses from losing trades. A profit factor greater than one indicates a profitable strategy, and in this case, the value far exceeds that threshold, reaffirming the strategy’s overall profitability.
The expectancy of the strategy, which calculates the average amount one can expect to win or lose per trade, is also noteworthy at 7.82%. This figure is particularly useful for investors as it provides a more granular view of what each trade is likely to contribute to the overall capital.
Trade durations within this strategy vary, with the longest trade lasting 63 days and the average trade concluding after 46 days. These durations are indicative of the short- to medium-term nature of the strategy, aligning well with the monthly seasonality approach and allowing for periodic assessment and adjustment.
The System Quality Number (SQN), which measures the system’s performance in terms of risk-adjusted return, stands at 2.367. This value, which is derived from the expectancy and the standard deviation of the R-multiples of the trades, further supports the robustness of the strategy. An SQN above 2.0 is generally considered good and suggests that the strategy’s returns are not only high but also consistent.
Conclusion
In conclusion, the meticulous analysis of the monthly seasonality trading strategy for General Motors Company has unveiled a dynamic approach to stock market investment that leverages historical patterns for potential gains. The strategy’s impressive return of over 504% compared to the buy & hold return of 37.96% demonstrates its efficacy over the examined period. Its selective market engagement, based on the seasonality of stock performance, suggests a more refined and potentially less risky method of investing compared to constant market exposure.
The robust annualized returns, peak equity values, and a respectable Sharpe ratio indicate that the strategy not only capitalized on the specific temporal trends but did so with a commendable balance of risk and reward. The win rate of the trades and the contained drawdowns further underscore the strategy’s credibility and the possibility of its application as a viable investment approach.
However, while the historical data paints a promising picture of the strategy’s past performance, investors must remember that past success is not a guaranteed predictor of future results. Moreover, risk tolerance, market conditions, and personal investment goals should always be considered before adopting any investment strategy.
The seasonal trading strategy for General Motors Company stands as an intriguing example of how a well-researched and disciplined approach to market seasonality can yield significant returns. As investors continue to seek out strategies to navigate the complexities of the stock market, the insights drawn from seasonal trends could indeed serve as a valuable tool in their investment arsenal.

“Make the invisible visible. My goal is to shine a light on the subtle seasonal signals in the stock market, providing investors with the insight needed to make informed decisions. By breaking down the complexities of seasonality, I strive to empower our audience with knowledge and foresight, turning data into action.”