


Investors often seek strategies that can shave the edges of market volatility and provide a roadmap through the labyrinth of stock market fluctuations. One such approach that lures both the curious and the calculated is the concept of seasonality in trading. As we unfold the pages of Amazon’s stock performance, a company that has revolutionarily redefined retail and technology, we observe a pattern that might just be the compass investors have been searching for in the sea of uncertainty.
Company Overview
Amazon, the behemoth that began as a simple online bookstore, has burgeoned into a multifaceted titan of e-commerce, cloud computing, digital streaming, and artificial intelligence. With its flagship marketplace, it has created a global retail space that brings everything from A to Z to our doorsteps. Alongside, its Amazon Web Services (AWS) has emerged as the backbone of cloud infrastructure for a myriad of businesses, further cementing its position as an indispensable asset in the digital age.
Strategy Overview
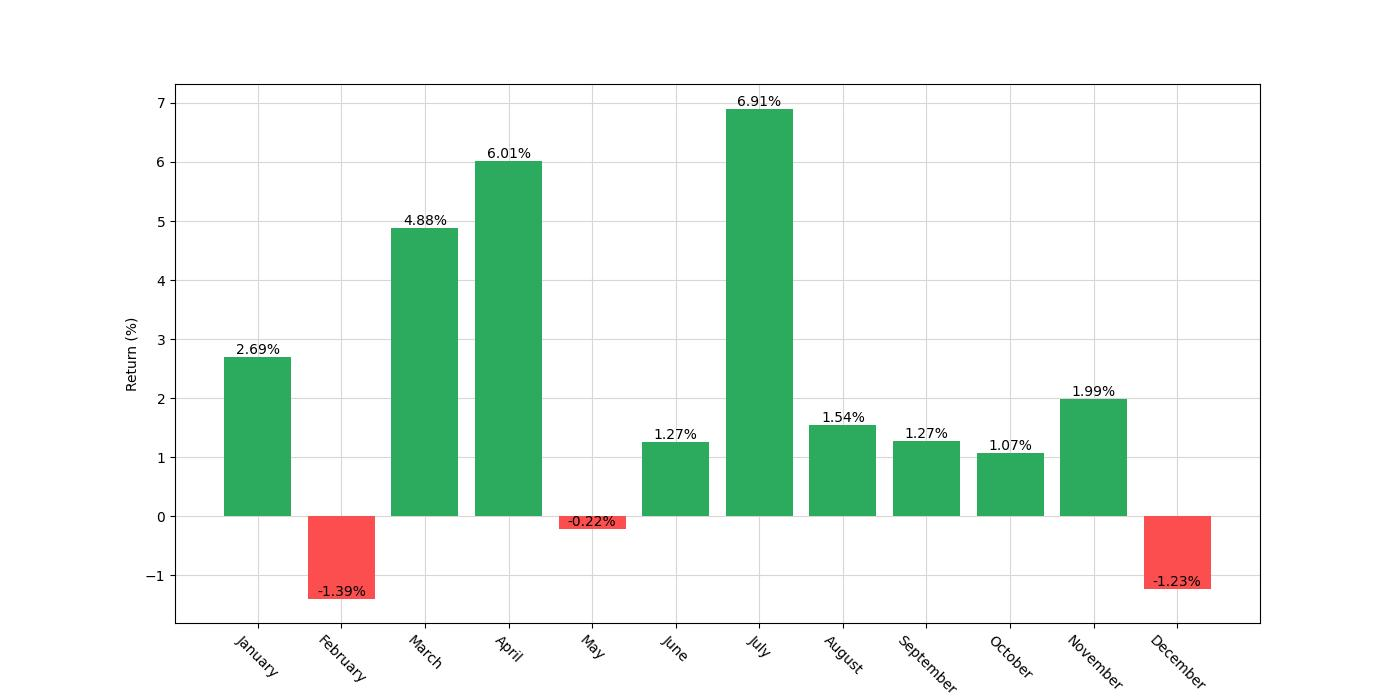
The strategy in focus is one that capitalizes on the historical monthly seasonality of Amazon’s stock (AMZN). The premise is simple: go long in the months of March, April, July, and November while taking a short position in December. This approach stems from the observed performance trends of Amazon’s stock over the years. The study spans nearly two decades, from the start of 2003 to the end of 2022, encapsulating 7302 days of trading data. During this period, the strategy kept investors exposed to the market for approximately 43% of the time, a balanced approach that seeks to capture gains while mitigating overexposure.
Key Performance Indicators
The efficacy of any trading strategy is best gauged by its performance metrics. By the conclusion of the backtest, the strategy bolstered the initial capital of $10,000 to an impressive final equity of $360,752. At its zenith, the equity peak reached $368,568. This translates to a return of 3507.52%, a substantial figure albeit shy of the 8484.57% buy-and-hold return of Amazon’s stock. The annualized return stood at 19.66%, a testament to the strategy’s ability to grow wealth over time.

| Strategy | Buy and Hold | |
|---|---|---|
| Start Date | 2003-01-02 | 2003-01-02 |
| End Date | 2022-12-30 | 2022-12-30 |
| Duration | 7302 days | 7302 days |
| Exposure Time [%] | 43.02 | 99.96 |
| Equity Final [$] | 360752.04 | 820418.88 |
| Equity Peak [$] | 368568.36 | 1818311.82 |
| Return [%] | 3507.52 | 8104.19 |
| Return (Ann.) [%] | 19.66 | 24.68 |
| Volatility (Ann.) [%] | 32.4 | 50.64 |
| Sharpe Ratio | 0.61 | 0.49 |
| Sortino Ratio | 1.19 | 0.97 |
| Calmar Ratio | 0.43 | 0.38 |
| Max. Drawdown [%] | -46.03 | -65.25 |
| Avg. Drawdown [%] | -5.81 | -5.7 |
| Max. Drawdown Duration | 623 days | 1288 days |
| Avg. Drawdown Duration | 59 days | 43 days |
| # Trades | 80 | 1 |
| Win Rate [%] | 71.25 | 100.0 |
| Best Trade [%] | 56.69 | 8104.68 |
| Worst Trade [%] | -30.48 | 8104.68 |
| Avg. Trade [%] | 4.58 | 8104.68 |
| Max. Trade Duration | 63 days | 7300 days |
| Avg. Trade Duration | 39 days | 7300 days |
| Profit Factor | 3.08 | nan |
| Expectancy [%] | 5.5 | 8104.68 |
| SQN | 2.54 | nan |
Risk Management
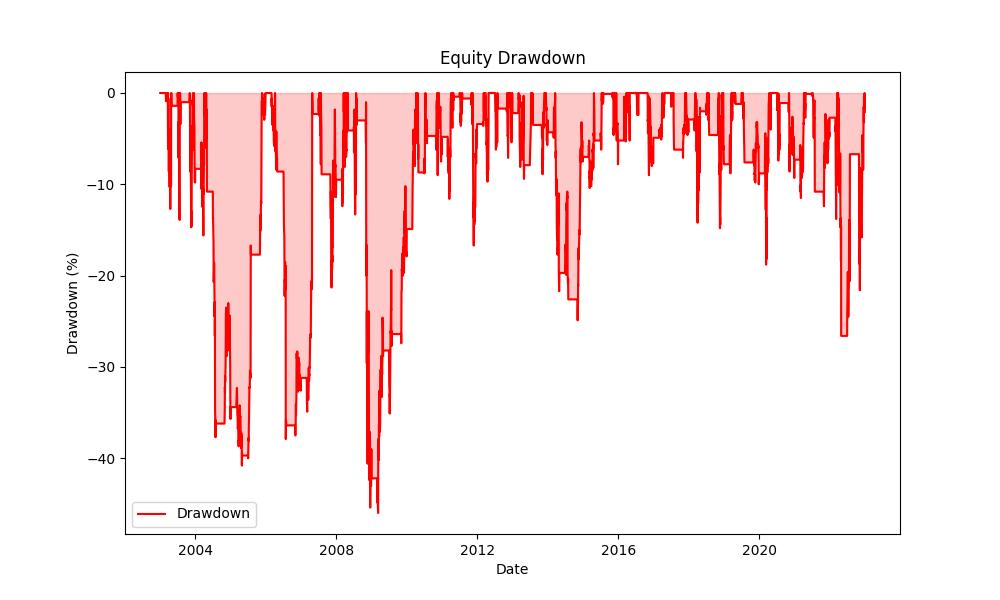
In trading, returns are only one side of the coin; the other is risk. The annualized volatility recorded was 32.40%, aligning with the strategy’s moderate exposure time. The Sharpe Ratio, a measure of risk-adjusted return, was 0.61, indicating that the strategy provided a reasonable excess return for the volatility endured by investors. The strategy faced its toughest phase with a maximum drawdown of 46.03%, with an average drawdown lurking around 5.81%, suggesting occasional significant dips in portfolio value. The longest drawdown period lasted 623 days, whereas on average, drawdowns resolved within 59 days.
Trade Analysis
Over the course of the backtesting period, the strategy executed a total of 80 trades. A win rate of 71.25% suggests a high probability of successful trades within the strategy’s parameters. The most profitable trade soared at 56.69%, while the least favorable trade plummeted by 30.48%. The average trade yielded a 4.58% return, with trades typically lasting 39 days, and the longest trade spanned 63 days. The Profit Factor of 3.08 and an Expectancy of 5.50% further reinforce the strategy’s potential for profitability.

Conclusion
Navigating the stock market with a seasonal strategy offers an intriguing blend of methodical investing and tactical asset allocation. While the backtest showcases a promising outlook for this Amazon-specific monthly seasonality strategy, it’s crucial for investors to recognize the inherent risks and the fact that past performance is not indicative of future results. With a robust win rate and a prudent balance between exposure and retreat, this strategy holds merit for those looking to harmonize their portfolio with the rhythm of Amazon’s historical stock performance.


“Make the invisible visible. My goal is to shine a light on the subtle seasonal signals in the stock market, providing investors with the insight needed to make informed decisions. By breaking down the complexities of seasonality, I strive to empower our audience with knowledge and foresight, turning data into action.”