


Introduction
Welcome to the rhythmic world of stock markets, where time itself seems to play a pivotal role in shaping investment outcomes. As the seasons shift and the calendar pages turn, astute investors have observed that there’s more to market fluctuations than mere chance. Seasonality—a patterned change in stock performance correlating with the time of year—can be as influential on stock prices as it is on the weather.
In this blog, we dive deep into the ebb and flow of Element Solutions Inc’s (ESI) stock performance, uncovering how the nuances of the calendar months can be harnessed to craft a compelling trading strategy. This isn’t just about the “sell in May and go away” adage; this is about a systematic, data-driven approach that seeks to exploit recurring seasonal trends that have been lying in plain sight.
Join us as we explore a decade-spanning journey through market trends, backtested strategies, and the meticulous analysis of ESI’s stock movements. Whether you’re a seasoned investor seeking to refine your portfolio strategy or a curious newcomer eager to understand the forces that drive market dynamics, this exploration will serve as a beacon, guiding you through the intricacies of seasonal trading strategies and helping you make informed decisions with confidence and clarity.
Step by step, we will break down complex data and present you with an engaging narrative that not only informs but also empowers. So, prepare to embark on a fascinating voyage through the seasons of the stock market, where knowledge becomes the wind in the sails of your investment journey.
Company Overview
ESI Element Solutions Inc., headquartered in Louisville, Kentucky, is a global specialty chemicals company serving advanced technology industries. Its core products include ultra-pure chemicals, specialty materials, and integrated solutions used in electronic devices, semiconductors, batteries, and various industrial applications. ESI Element Solutions caters to a diversified customer base across electronics, life sciences, healthcare, consumer products, and industrial markets. The company’s revenue streams are derived from the sale of these products and integrated solutions, along with technical services and contract manufacturing. ESI Element Solutions’ value proposition lies in its expertise in developing and delivering high-performance materials that meet the stringent requirements of its customers, enabling them to innovate and differentiate their products. The company operates a network of production and distribution facilities strategically located near key customer clusters. Its growth strategy focuses on expanding into new markets, developing innovative products, and pursuing strategic acquisitions. The specialty chemicals industry is characterized by rapid technological advancements, intense competition, and evolving regulatory requirements. ESI Element Solutions navigates this dynamic landscape by continuously investing in research and development, maintaining a strong focus on operational efficiency, and adhering to the highest standards of environmental stewardship and corporate governance.
Strategy Overview
Element Solutions Inc (ESI) has been the subject of a fascinating study in the realm of seasonal stock market trading strategies. Today, we unravel the intricacies of a trading approach that leverages the predictable patterns which certain months seem to imprint on the company’s stock performance.
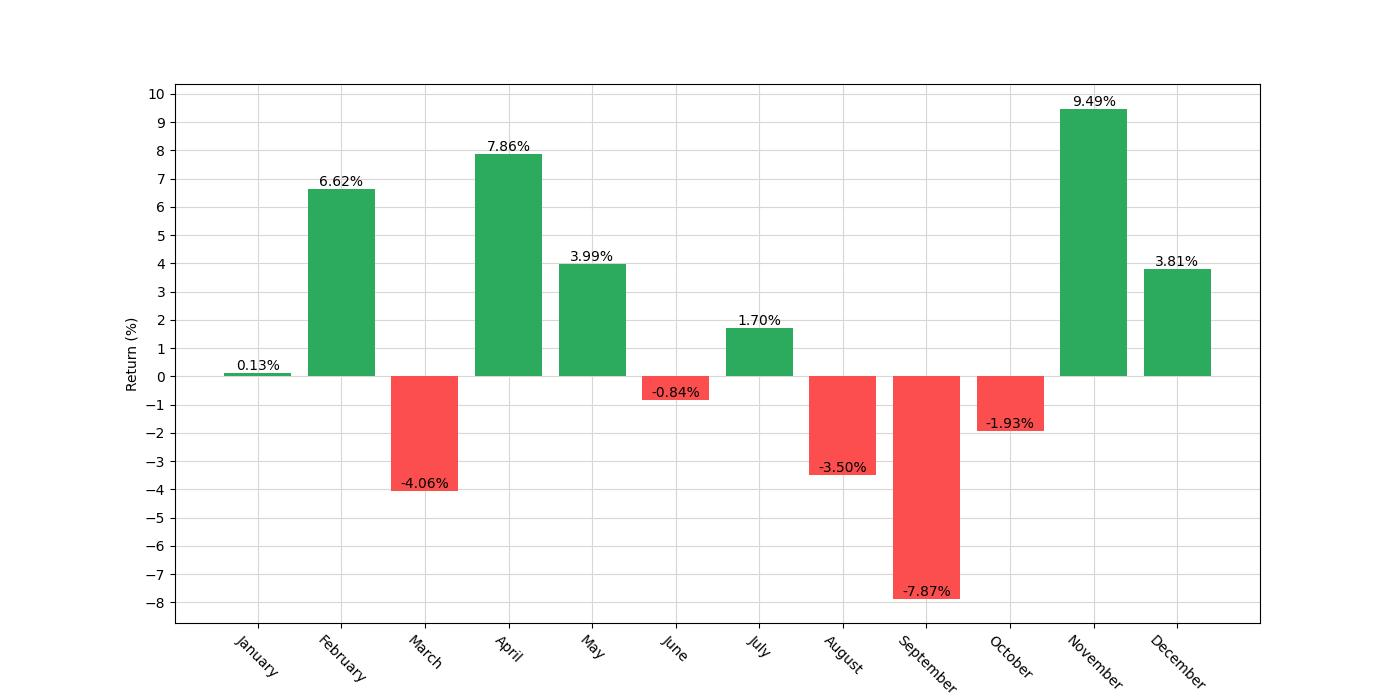
The strategy under scrutiny is straightforward in its premise: it capitalizes on the close-to-close price changes of ESI’s stock during select months that historically exhibit bullish or bearish tendencies. Specifically, the strategy dictates taking a long position—buying with the expectation that the stock will rise—for the months of February, April, July, and November. Conversely, a short position—selling with the expectation of a decline in stock price—is taken for the months of March, August, and September.
This strategy was backtested over a significant period, starting on October 22, 2013, and extending to December 29, 2023, covering a span of 3720 days, or just over a decade. Such a duration provides a robust dataset to assess the effectiveness of the seasonal approach.
During the backtest, the strategy involved active trading for approximately 58.87% of the time. This figure, known as the Exposure Time, indicates that for a little more than half of the backtesting period, the capital was at risk in the market, which is a considerable amount of time and suggests a moderate level of market engagement.
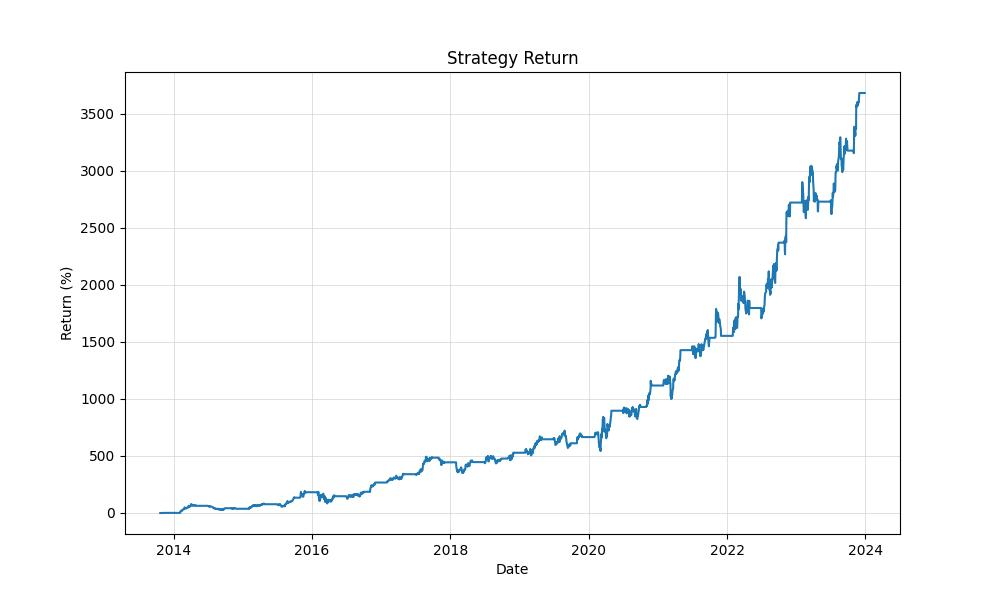
Operating on an initial capital investment of $10,000, the strategy’s backtesting results are nothing short of impressive. The closing equity, i.e., the final account balance after all trading activity, ballooned to a staggering $377,985.76. This figure also represents the Equity Peak, the highest value the account reached, underscoring the absence of significant retracements from the strategy’s peak performance.
When we shift our focus to returns, the sheer scale of the strategy’s success becomes evident. The overall return on the initial investment reached 3679.86%, a figure that dwarfs the 101.98% return generated by a simple buy-and-hold approach over the same period. This stark contrast emphasizes the potential benefits of an active trading strategy over passive investment, at least within the context of this backtest.
We also measure success by annualized returns, which normalize performance over a yearly basis. Here, the strategy delivered a return of 42.88% per annum, a robust indicator of its profitability and a testament to the strategy’s ability to capitalize on seasonal market trends.
As we delve into these numbers, it’s important to remember that this backtest did not account for potential transaction costs like commissions and slippage, which can eat into profitability. Nonetheless, the results provide a compelling case for the value of seasonal trading strategies when applied to companies like Element Solutions Inc, especially when juxtaposed with buy-and-hold strategies. Such insights can serve as a guiding light for investors aiming to navigate the temporal ebb and flow of the stock market with precision and confidence.
Key Performance Indicators
Investors often seek out strategies that promise to outperform the market, and a compelling approach to consider is the implementation of a monthly seasonality trading strategy. By analyzing Element Solutions Inc, a company traded under the symbol ESI, we’ve uncovered some intriguing data that might pique the interest of those looking to optimize their trading based on seasonal trends.
The strategy in question entails initiating long positions during the months of February, April, July, and November, while taking short positions in March, August, and September. This method, running from the start date of October 22, 2013, to the end date of December 29, 2023, covered a span of 3720 days, with the strategy being active for approximately 58.87% of that time. This indicates a moderate level of market exposure, suggesting a balanced approach between being invested and being in cash.
Turning our attention to the financial outcomes of this strategy, we notice a remarkable ascent in equity from the initial capital of $10,000 to a final equity sum of $377,985.76. This peak equity value also stands as the highest value reached during the backtest period, showcasing the strategy’s capacity to sustain gains without significant retracement.
When we compare this to the traditional buy and hold approach, the difference is stark. The buy and hold method yielded a final equity of $20,475.58 from the same initial $10,000 over the same period, which, while still a respectable gain, pales in comparison to the results of the monthly seasonality strategy.
Diving deeper into the returns, the monthly seasonality strategy provided an eye-opening cumulative return of 3679.86%, dwarfing the buy and hold return of 101.98%. On an annualized basis, this translates to a 42.88% return for the seasonality strategy, greatly surpassing the 7.29% return of the buy and hold approach. Such figures are indicative of the potential power of targeted seasonal trading methods over more passive investment styles.
Risk Management
When assessing any investment strategy, understanding the associated risks is paramount. In the realm of trading, risk management is not only about mitigating potential losses but also about maximizing returns while maintaining an acceptable level of risk. We’ll delve into the intricacies of the risk profile for the backtested monthly seasonality trading strategy applied to Element Solutions Inc (ESI).
The annual volatility, which measures the extent of variation in trading returns, stands at 44.34%. In layman’s terms, this indicates a relatively high level of fluctuation in the strategy’s returns when compared to less volatile investments. High volatility often scares off the faint-hearted investor; however, it is also a signpost of potential for substantial gains, which seems to be the case here.
Evaluating the Sharpe Ratio, which is at 0.967, offers insight into the risk-adjusted return of the strategy. A Sharpe Ratio closer to 1 suggests that an investor is being adequately compensated for the additional risk taken on with this strategy over a risk-free investment. In this scenario, the Sharpe Ratio is signaling that the returns are quite attractive when the risk level is considered.
A more profound understanding of the risk comes from examining the maximum drawdown, which was -36.87%. The maximum drawdown measures the largest drop from peak to trough before a new peak is achieved. It’s a crucial metric because it gives an investor a sense of the potential loss that could occur in a worst-case scenario. While a drawdown of this magnitude is significant, it is not uncommon in strategies that yield high returns.
The average drawdown at -4.92% and the average drawdown duration of 31 days provide additional color to the risk narrative. These figures suggest that, while the strategy may have periods of decline, they are relatively moderate on average and do not last very long, which may be comforting for investors who are concerned about sustained downturns.
The maximum drawdown duration was recorded at 371 days, which is a considerable period to be in a drawdown and could test the patience and resolve of investors. Nonetheless, the high annual return of 42.88% suggests that, historically, those who weathered the drawdowns were well-compensated over the long term.
It’s imperative for investors to consider these risk factors in the context of their individual risk tolerance and investment goals. While the backtested strategy for ESI shows a promising return profile, the associated risks underscore the importance of a well-thought-out risk management plan in any trading endeavor.

Trade Analysis
In the world of trading, numbers often speak louder than words. A meticulous dive into the trade analysis of Element Solutions Inc’s monthly seasonality strategy reveals a tapestry of data that is as illuminating as it is compelling for the keen investor.
Over the course of the backtesting period, which spans nearly a decade, the strategy executed a total of 61 trades. This number suggests a methodical approach, one that doesn’t overindulge in market fluctuations but instead waits for those opportune seasonal moments to strike. It’s a disciplined dance with time, and the results are telling.
The win rate presents a robust picture of success, standing at an impressive 75.41%. For retail investors, this translates to three out of every four trades ending in profit—an encouraging statistic that underscores the strategy’s efficacy. Success in trading is often about playing the odds intelligently, and with this win rate, the odds are tilted in the investor’s favor.
Peering into the peaks and valleys of the strategy’s performance, we find that the best trade yielded a staggering 46.91% return. Such a figure is the kind that can make a significant impact on an investment portfolio, showcasing the potential of well-timed entries and exits during specific months. On the flip side, the strategy’s worst trade saw a decline of 21.30%, a reminder that even the most seasoned strategies are not impervious to the market’s ebb and flow.
But these highs and lows are part of a broader narrative. The average trade outcome stands at a healthy 6.14%, which is a more representative indicator of what an investor might expect from each trade on average. This figure, combined with a high win rate, paints a picture of a strategy that provides consistent, though not extravagant, returns over time.
Duration is another factor that often gets overshadowed by more glaring numbers. However, it is a vital aspect of understanding a strategy’s operational rhythm. The average trade duration of 36 days indicates a holding period that is neither fleeting nor excessively long. It strikes a balance, allowing enough time for the seasonal trends to play out while not overexposing the investment to unnecessary market risk.
The maximum trade duration was recorded at 63 days, implying that while the strategy generally adheres to a monthly pattern, it can occasionally capitalize on trends that persist beyond the typical one-month window.
Now, to the metrics that often determine a strategy’s long-term viability: the Profit Factor and Expectancy. A Profit Factor of 5.06 is a robust signal of the strategy’s profitability, suggesting that the gross profits are substantially higher than the gross losses. This metric is like a seal of quality on the strategy’s ability to generate profits over time.
Expectancy further cements this narrative with a value of 6.80%. In simple terms, this means that for every dollar risked, the strategy can expect to return around 6.8 cents on average. This is a crucial figure for retail investors as it provides a distilled essence of the strategy’s performance, combining the win rate, the size of wins, and the size of losses into a single, forward-looking metric.
While the System Quality Number (SQN) might not be as widely recognized as other indicators, with a value of 4.05, it indicates a very good system. This score reflects the strategy’s stability and consistency, taking into account the frequency and size of wins relative to losses.
In essence, the trade analysis of Element Solutions Inc’s monthly seasonality strategy is a testament to the power of systematic trading based on historical seasonal patterns. The backtest results suggest a strategy that not only has the potential to grow capital through a high win rate and controlled trade durations but also one that does so with a level of consistency and profitability that is likely to pique the interest of any retail investor looking for an edge in the market.

Conclusion
In conclusion, the detailed examination of Element Solutions Inc’s seasonal trading strategy has provided investors with a compelling narrative backed by a decade of backtested data. The strategy’s impressive performance metrics, with a striking 3679.86% cumulative return over the test period and a robust annualized return of 42.88%, highlight the potential merits of a well-crafted seasonal trading approach. Furthermore, the high win rate of 75.41% and disciplined trade execution, averaging 61 trades across nearly ten years, underscore the strategy’s effectiveness.
However, it’s crucial to remember that these results do not factor in transaction costs, and the inherent risks associated with a strategy exhibiting an annual volatility of 44.34% and a maximum drawdown of -36.87%. These risk metrics serve as a stark reminder that high returns often come with elevated levels of risk, which must be carefully managed.
The analysis has also revealed that while the strategy does experience drawdowns, they are typically short-lived, and the long-term gains have historically more than compensated for these periods of decline. The trade analysis further supports the strategy’s reliability, with a Profit Factor of 5.06 and an Expectancy of 6.80%, indicating a strong potential for average profitability per trade.
Ultimately, the findings suggest that a monthly seasonality trading strategy, when applied with discipline and a keen awareness of risk, can offer a significant edge to investors seeking to outperform passive investment approaches. The success of the strategy hinges on its ability to harness seasonal market trends, a concept that could be effectively integrated into the broader investment framework of those willing to embrace the temporal patterns of the stock market. Investors are encouraged to weigh these insights against their individual risk tolerance and investment objectives to determine if such a strategy aligns with their personal financial goals.


“Make the invisible visible. My goal is to shine a light on the subtle seasonal signals in the stock market, providing investors with the insight needed to make informed decisions. By breaking down the complexities of seasonality, I strive to empower our audience with knowledge and foresight, turning data into action.”