


Introduction
In the ever-evolving tapestry of the stock market, seasonal patterns weave a narrative of opportunity for the astute investor. The dance of supply and demand choreographs itself differently throughout the year, and understanding these rhythmic movements can unlock the door to profitable trading strategies. With the advent of big data and computational analytics, the ability to discern these patterns has never been more accessible, offering investors a chance to gain an edge in a highly competitive arena.
Whether it’s the warming optimism of spring or the year-end rally often observed in equities, seasonality can serve as a beacon for navigating the complex financial seas. But beyond mere folklore and trader lore, there lies empirical evidence that supports certain seasonal trends in the stock market. Such is the case with Emerson Electric Co. (EMR), whose historical performance has revealed a tantalizing pattern of monthly seasonality—a pattern that, when strategically harnessed, has shown the potential to augment investor returns.
However, in the intricate world of investing, where every strategy carries its shadow of risk, a thorough and nuanced understanding of these temporal market trends is crucial. It is not enough to merely ride the wave of seasonal highs; one must also be adept at dodging the undercurrents of potential lows. This delicate balance of risk and reward, informed by historical data and statistical rigor, forms the cornerstone of a sound seasonal investment strategy.
As we delve into the depths of this strategy’s performance, risk management, and trade analysis, we unravel the threads of seasonality within the stock market. We’ll explore how these insights can be synthesized into a coherent plan of action, tailored for retail investors who yearn to harness the cyclical nature of the markets to their advantage. The journey through the seasonality of Emerson Electric Co.’s stock is not just a lesson in timing the market, but a testament to the power of strategic, data-driven decision-making in the pursuit of financial growth.
Company Overview
Emerson Electric Co. (EMR), a global technology and engineering leader, empowers customers to achieve operational excellence. Founded in 1890, the company operates in two segments: Automation Solutions and Commercial & Residential Solutions. Emerson’s comprehensive portfolio spans automation technologies, software, and services for industrial, commercial, and residential markets. It targets process, hybrid, and discrete industries, enhancing productivity, energy efficiency, and safety. Emerson’s revenue streams comprise product sales, service contracts, project execution, and software licensing. Its value proposition lies in expertise in sensing, actuation, control, and software, addressing customers’ needs for improved performance, reliability, and sustainability. Emerson’s operational model emphasizes innovation, operational efficiency, and strategic acquisitions. The company’s growth strategy focuses on expanding its digital transformation offerings, addressing emerging markets, and pursuing strategic partnerships. Operating in a dynamic industry characterized by technological advancements, Emerson competes with global automation and technology giants. Its strong brand reputation, diverse product portfolio, and focus on innovation position it well to navigate industry challenges and capitalize on growth opportunities.
Strategy Overview
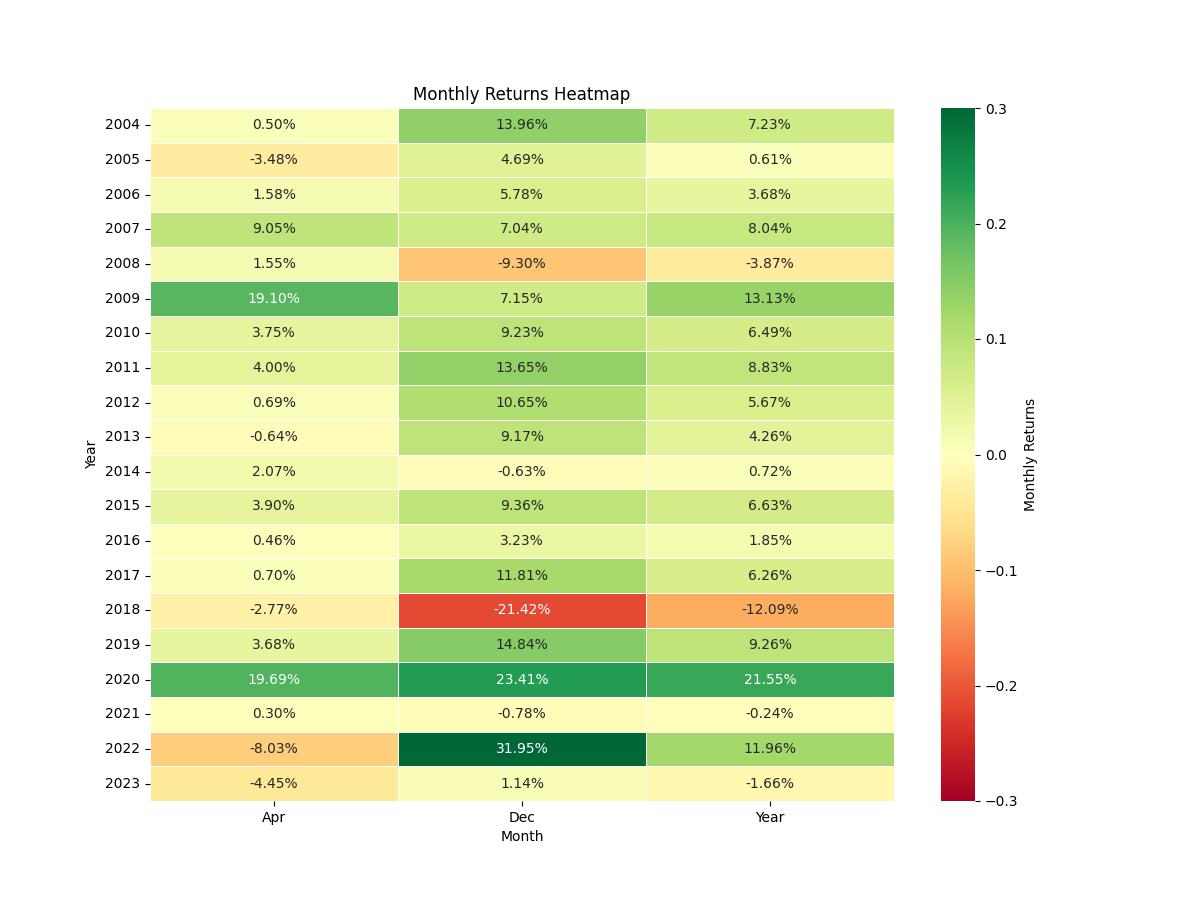
Embarking on an investment journey with Emerson Electric Co. (EMR), a seasoned player in the electrical equipment manufacturing arena, necessitates a strategic approach that capitalizes on temporal market movements. When dissecting the performance of EMR, we unearth a fascinating pattern: a monthly seasonality trading strategy that has been backtested over an extensive period, from January 2, 2004, to December 29, 2023, encapsulating 7301 days of trading activity.
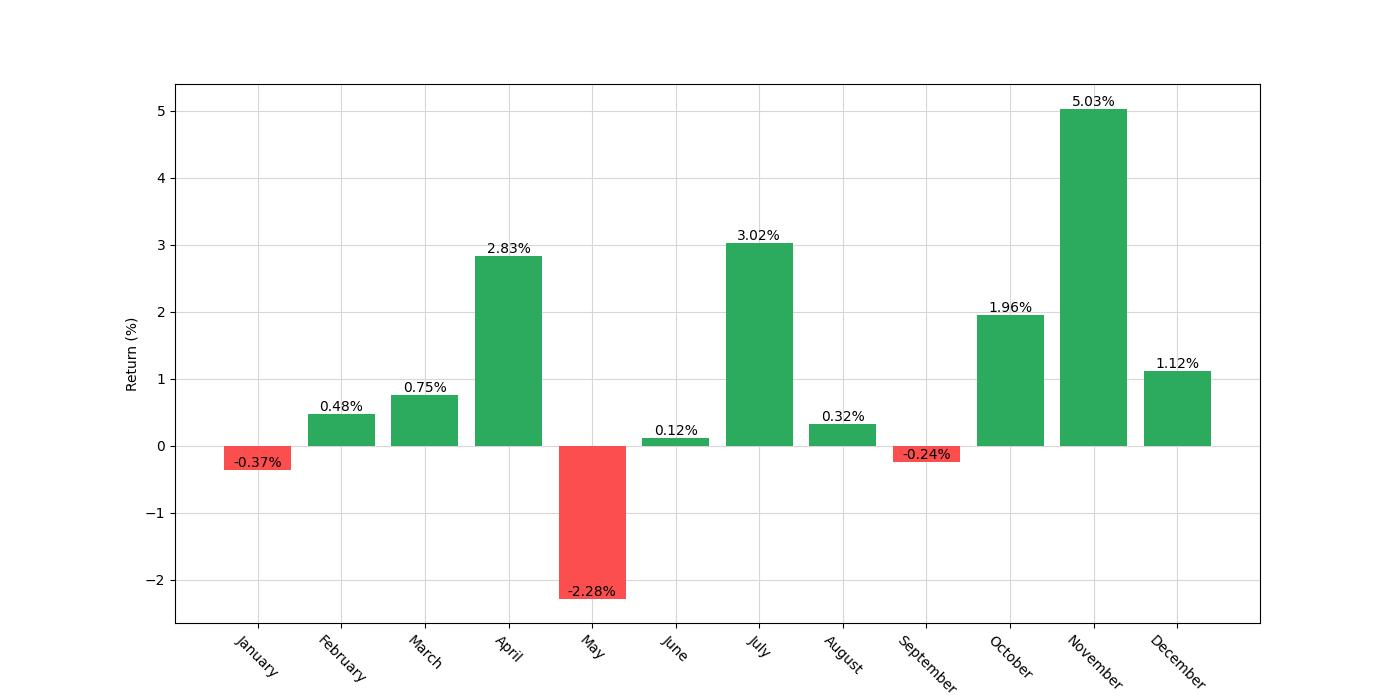
This strategy hinges on a simple yet robust premise. Investors are advised to initiate a long position, that is, buy shares of EMR during the months of April, October, November, and December. The selection of these months is not arbitrary; it’s rooted in historical performance data that suggests these periods typically herald favorable outcomes for EMR’s stock. Notably, the strategy steers clear of short positions, which involves betting against the stock, reflecting a bullish outlook on EMR’s performance during these months.
During the backtesting phase, the strategy was executed with an initial capital of $10,000. The results are compelling, with the strategy’s exposure time—defined as the percentage of time the strategy was actively engaged in the market—standing at 34.19%. This strategic market exposure ensures that capital is not overexposed to the inherent volatility of the stock market, thereby mitigating risk.
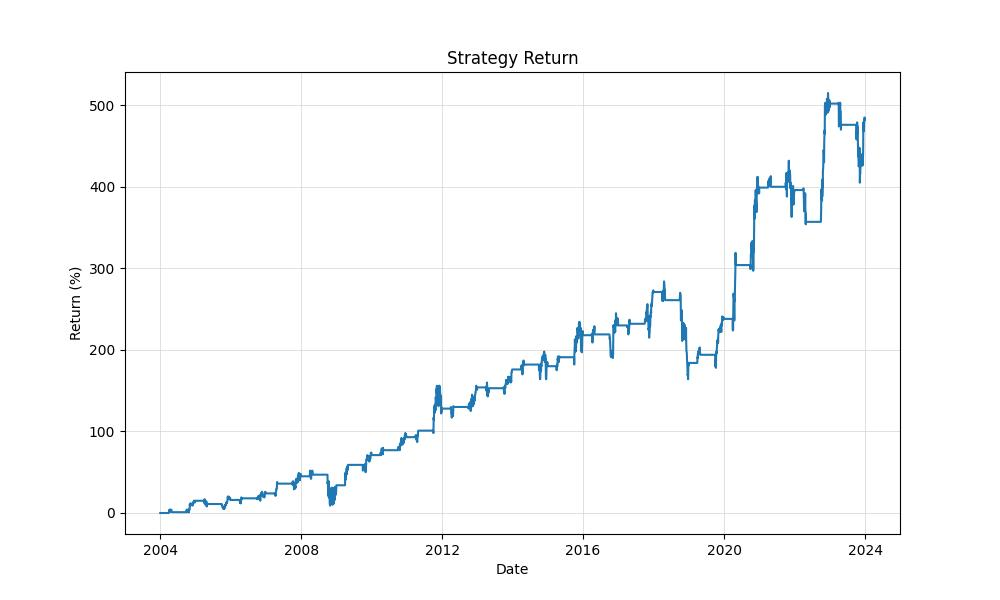
The backtesting results provide a granular view of the strategy’s efficacy. Over the nearly two-decade period, the strategy bolstered the initial capital to an impressive equity final of $58,221.99, with an equity peak reaching $61,505.29. When pitted against a passive “buy and hold” approach, the strategy demonstrates its mettle with a total return of 482.22%, surpassing the buy and hold return of 426.09%. On an annualized basis, this translates to a return of 9.22%, an attractive figure for investors seeking to outpace average market gains.
This strategic blueprint offers a compelling narrative for retail investors. It showcases the power of leveraging seasonal trends within the stock market to enhance investment outcomes. By embracing a disciplined approach that aligns with historical monthly performance, investors can navigate the vicissitudes of the market with a greater sense of confidence and clarity. The backtesting results not only validate the strategy’s potential to generate robust returns but also underscore the importance of strategic timing in the pursuit of stock market gains.
Key Performance Indicators
When exploring the realm of stock market investments, it’s essential for investors to understand how a trading strategy performs over time. The tale of Emerson Electric Co. (EMR) under a monthly seasonality trading strategy offers a fascinating glimpse into the potential of timing the market based on historical patterns.
Firstly, looking at the overall growth of the initial investment is critical. The backtesting results show that an initial capital of $10,000, when applied to this specific strategy from the beginning of 2004 through the end of 2023—a span of nearly two decades—has blossomed into an impressive $58,221.98. This figure not only represents the ending balance but is also a testament to the strategy’s effectiveness over the long term.
Peering at the peak equity value reached during the backtesting period can provide insights into the strategy’s highest potential. For this strategy, the peak equity recorded was $61,505.29. This peak gives investors an idea of the maximum value the portfolio achieved before any subsequent drawdowns occurred—offering a glimpse of what’s possible during optimal market conditions.
The return on investment (ROI) is a cornerstone metric for evaluating a strategy’s success. The strategy has yielded a 482.22% return over the nearly 20-year period, which is significantly higher than the buy and hold strategy’s return of 426.09% for the same period with Emerson Electric Co. It’s important to note that the buy and hold approach, where an investor simply purchases a stock and holds onto it for a long period, is a common benchmark used to assess the effectiveness of more active trading strategies. The fact that the seasonal strategy outperforms the buy and hold return suggests that for Emerson Electric Co., timing the market with this strategy could have been more advantageous than a passive investment approach.
However, not all returns are created equal when you account for the passage of time. This is where the annualized return comes into play, providing a standardized way to compare the profitability of investments over different periods. The seasonal strategy achieved an annualized return of 9.22%, which closely competes with the buy and hold annualized return of 8.58%. The slight edge in annualized returns indicates that the seasonal strategy not only provided higher overall returns but also offered a modestly better annual growth rate on the initial investment.
These figures illustrate a compelling story of how a systematic approach to investing, based on the historical seasonal patterns of Emerson Electric Co., has the potential to yield fruitful results. Such a strategy could be an attractive proposition for retail investors who are willing to delve into the nuances of market seasonality and leverage this understanding to enhance their investment portfolios.
Risk Management
Navigating the fluctuations of the stock market requires not only a keen understanding of trading strategies but also a robust approach to risk management. For investors considering the monthly seasonality trading strategy applied to Emerson Electric Co. (EMR), it’s essential to dissect the potential risks and rewards to make informed decisions.
The annualized volatility of this strategy clocks in at 18.54%, a significant number that embodies the ups and downs an investor might experience. Volatility is a double-edged sword: while it can lead to substantial gains during favorable market conditions, it also indicates the level of risk you’re exposed to. Comparatively, the buy and hold strategy for EMR showed a higher annualized volatility of 30.96%, suggesting that the seasonality strategy may offer a smoother investment journey.
However, volatility alone doesn’t paint the complete picture. When we pair it with the Sharpe Ratio, which stands at 0.497 for this strategy, we gain insight into the risk-adjusted returns. The Sharpe Ratio measures how much excess return you are receiving for the extra volatility that you endure for holding a riskier asset. Although a ratio above 1 is generally considered good, the given figure of 0.497 signals that the strategy’s returns are less than optimal in relation to the risks taken.
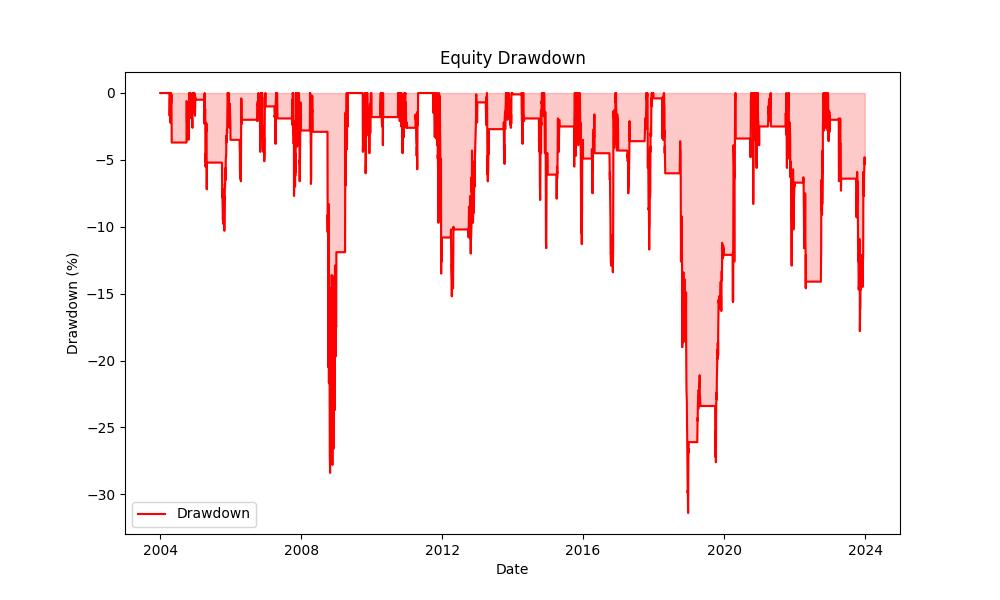
A critical aspect of risk management is understanding the depth and duration of drawdowns, or the declines from a peak to a trough. The maximum drawdown experienced with this strategy was -31.37%, a notable dip that would have required a strong stomach and patience from investors. It’s imperative to consider that this drawdown persisted for a considerable duration of 739 days, a timeframe that could test the resolve of many investors.
The average drawdown, standing at -3.80%, alongside the average drawdown duration of 65 days, offers a glimpse into the typical dips that one would face more frequently. These figures suggest that while steep declines are not a regular occurrence, investors should be prepared for moderate, short-term setbacks as part of the investment process.
Risk management isn’t just about bracing for the worst; it’s also about recognizing the potential for recovery and sustained growth. Despite the drawbacks mentioned, the ability of this trading strategy to recover from downturns and still provide substantial growth is noteworthy. The potential for recovery is a vital component for investors to consider when evaluating the suitability of any investment strategy.
In essence, the risk profile of this monthly seasonality trading strategy for EMR presents a nuanced landscape. With lower volatility and shorter average drawdown periods compared to a buy-and-hold approach, but with a Sharpe Ratio that urges caution, investors are encouraged to weigh these factors in the context of their individual risk tolerance and investment goals.
Trade Analysis
Diving into the trading strategy applied to Emerson Electric Co. (EMR), an interesting pattern emerges when examining the backtest results. This strategy, which involves establishing long positions during the months of April, October, November, and December, has been subjected to a rigorous backtesting process to gauge its effectiveness.
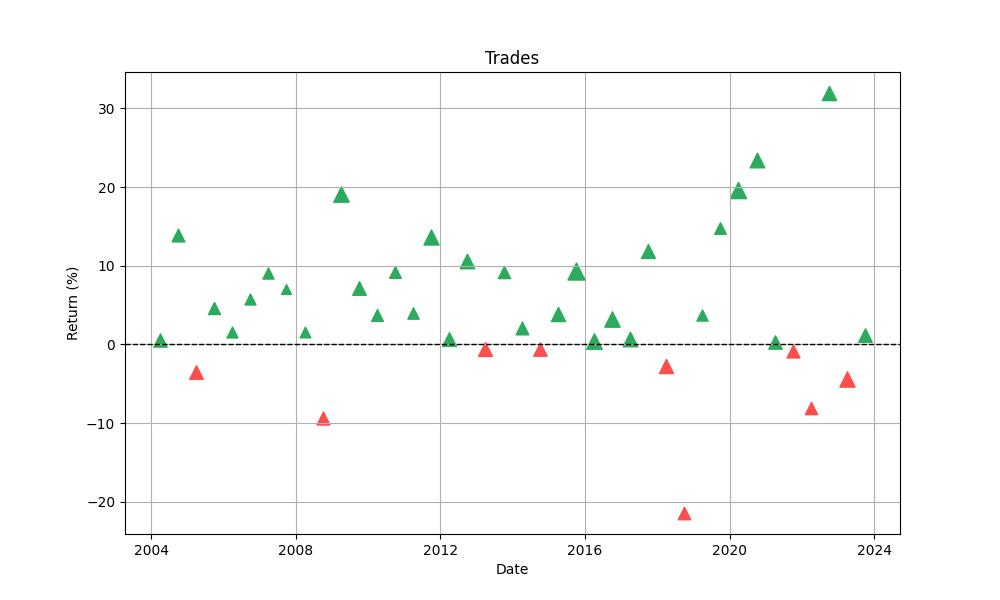
A closer look reveals that over the test duration, 40 trades were executed following the strategy’s predefined rules. Now, what matters to investors is not just the frequency of trades but their quality, and here’s where the strategy shows promise. The win rate—an indicator of the percentage of trades that were profitable—stands at an impressive 77.5%. For retail investors, this figure is a beacon of consistency and potential reliability, as it suggests that more often than not, the trades made under this strategy were on the right side of the market movements.
Peeking at the extremes, the best trade within this strategy yielded a remarkable 31.95% return, which speaks volumes about the strategy’s upside potential during its peak performance. Conversely, even the best-formulated strategies face setbacks, and this one is no exception, with the worst trade registering a 21.42% loss. While the loss is substantial, it’s important to note that it’s a single event within a broader context of more frequent gains.
When averaging out the performance of all trades, the strategy presents a 4.51% return per trade. This average is a robust indicator of what investors might expect from each trade on average, factoring in the wins and the losses. The duration of trades also plays a critical role in understanding the strategy’s operational dynamics. The longest trade remained open for 94 days, while on average, positions were held for about 61 days. These durations reflect a medium-term investment horizon, suggesting that the strategy doesn’t necessarily require daily monitoring, which could be appealing to investors not looking for extremely active trading.
Furthermore, the Profit Factor, a measure of the strategy’s profitability, stands at an encouraging 4.82. This indicates that the gross profit from the winning trades is nearly five times the gross loss from the losing trades, showcasing the strategy’s effectiveness in maximizing gains and minimizing losses.
Another critical statistic is the Expectancy, which represents the average amount investors can expect to win (or lose) per trade. With an expectancy of 4.91%, this strategy’s trades have, on average, returned nearly 5% per trade, a promising figure for investors looking for growth over time.
Lastly, the System Quality Number (SQN), which helps to determine the system’s overall quality by considering the trade results, risk, and consistency, stands at 2.23. While this number might not be extraordinarily high, it still indicates a reasonably good trading system, especially when coupled with the other positive indicators mentioned.
Conclusion
In conclusion, the seasonal trading strategy for Emerson Electric Co. (EMR) presents a compelling case for investors interested in leveraging historical patterns to optimize their stock market investments. The backtested strategy, with its selective long positions during certain months, has demonstrated an ability to surpass traditional buy-and-hold returns while offering a more favorable risk profile.
With nearly two decades of data backing its efficacy, this strategy has shown not just a higher total return but also an edge in annualized growth. The win rate of trades, coupled with a respectable expectancy and Profit Factor, reinforces the strategy’s consistency and potential profitability. While the Sharpe Ratio and maximum drawdown figures suggest the need for a measured approach to risk, these factors are balanced by the strategy’s lower volatility and shorter average drawdowns compared to a passive investment strategy.
Investors should take note of the strategy’s medium-term trade duration, which indicates that while the strategy is not excessively demanding in terms of daily engagement, it still requires a disciplined approach to capture the seasonal trends effectively. The robust return per trade and the overall quality of the trading system, as reflected by the SQN, further confirm the strategy’s soundness.
Ultimately, while no strategy is without risk, the backtested results of this monthly seasonality approach reveal a thoughtful way to potentially enhance returns and manage risk through strategic market timing. As with any investment decision, it is crucial for each investor to consider their individual financial goals, risk tolerance, and investment horizon before embarking on this or any other trading strategy. The insights gleaned from the historical performance of EMR underscore the importance of a well-researched, data-driven approach to the stock market, and this seasonal strategy stands as a testament to the value that such an approach can provide.

“Make the invisible visible. My goal is to shine a light on the subtle seasonal signals in the stock market, providing investors with the insight needed to make informed decisions. By breaking down the complexities of seasonality, I strive to empower our audience with knowledge and foresight, turning data into action.”