Introduction
As the leaves change color and the air cools, investors too experience seasons—periods characterized by patterns that, like the predictable shift from fall to winter, can influence the ebb and flow of stock market returns. Just as a farmer understands the best time to sow or reap, a savvy investor recognizes the importance of timing in the financial markets. Seasonality, a phenomenon where certain times of the year historically show different returns for the stock market, can be a powerful tool in an investor’s arsenal.
In the dynamic world of investing, where every second can mean the difference between profit and loss, it’s invaluable to have strategies that not only stand the test of time but also adapt to the rhythmic patterns of the market. The focus of our exploration today is not just any seasonal strategy, but one that has been refined through the lens of meticulous backtesting, revealing the potential for calculated entries and exits within the market’s calendar.
In this blog post, we will unfold the pages of a nearly two-decade-long story that chronicles the seasonality of Boston Properties, Inc. (BXP). Through the lens of historical performance, we will examine a strategy that harnesses the power of timing, discipline, and structured analysis to navigate the market’s seasonal waves. By dissecting the mechanics and outcome of this approach, investors can gain a deeper understanding of how to potentially tilt the scales in their favor, transforming the complexity of seasonal data into actionable insights. Join us as we demystify the seasonality of the stock market and unveil a trading strategy that has weathered the test of time, providing a beacon for investors charting their course through the temporal aspects of trading.
Company Overview
Boston Properties, Inc. (BXP) is a leading real estate investment trust (REIT) that acquires, develops, and manages Class A office properties in major metropolitan markets across the United States. As of December 31, 2022, the company’s portfolio comprised approximately 188 properties totaling 49.1 million square feet. BXP’s primary target market is large corporate tenants in the technology, financial services, and legal industries. The company’s revenue streams are primarily derived from rental income, development and construction fees, and property management fees. Its value proposition lies in its high-quality portfolio, strong tenant relationships, and expertise in property management and development. BXP employs an active asset management approach, continuously seeking opportunities to enhance the value of its properties through renovations, expansions, and repositioning. The company’s growth strategy centers around expanding its portfolio in existing markets, entering new markets, and developing mixed-use properties. The office real estate sector, in which BXP operates, is highly competitive and influenced by economic conditions, market cycles, and technological advancements. BXP’s success relies on its ability to adapt to changing market dynamics, maintain strong relationships with its tenants, and capitalize on emerging opportunities.
Strategy Overview
Embarking on a journey through the financial landscape, we find ourselves exploring the intricacies of a trading strategy that has been rigorously tested over nearly two decades. This particular approach zeroes in on the monthly seasonality of Boston Properties, Inc. (BXP), a Real Estate Investment Trust (REIT) that operates in the United States. Let’s delve into the mechanics of this strategy and its performance over time, providing valuable insights for investors inclined towards seasonally influenced market movements.
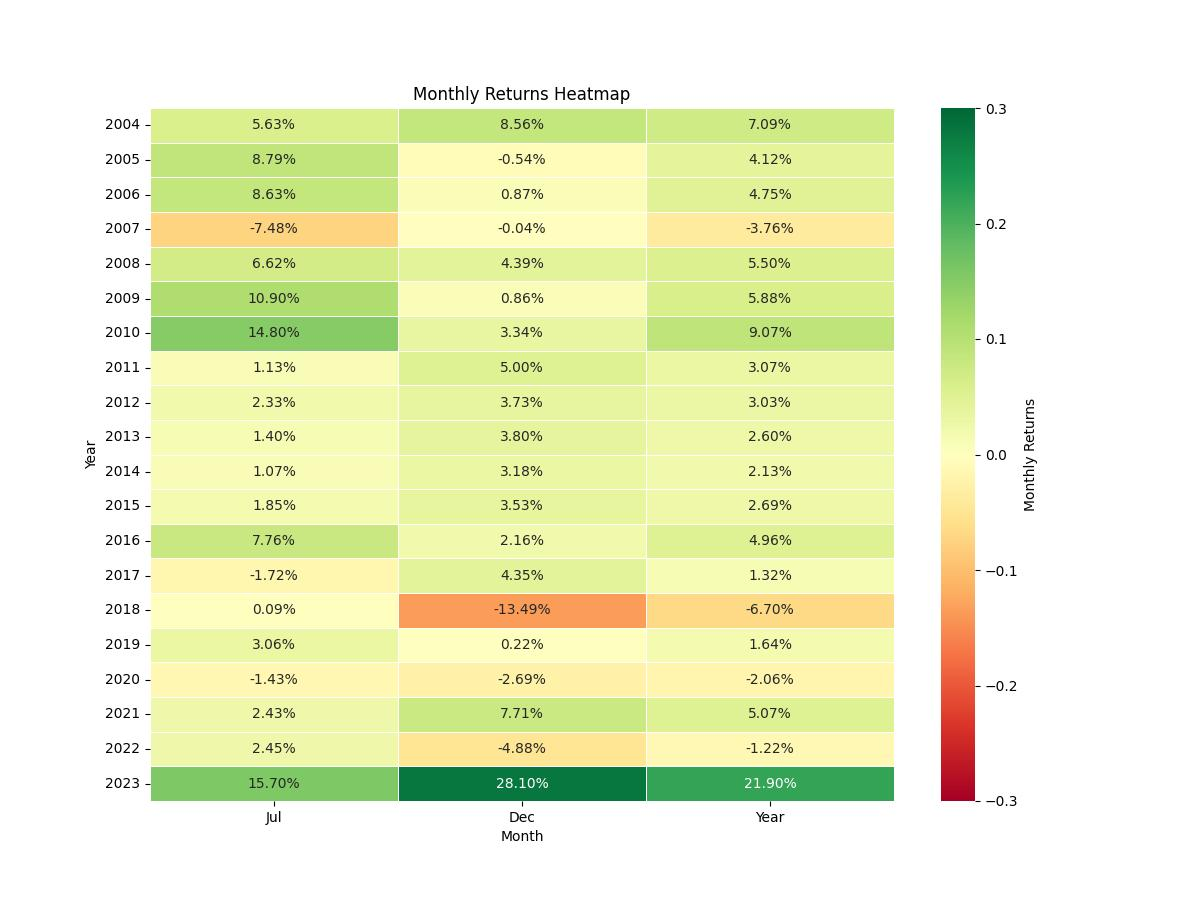
The strategy in question is elegantly simple in its design, subscribing to the principle of timing the market based on historical monthly patterns. Focusing on long positions, the strategy dictates entering the market at the close of June and November, to capitalize on the potential gains in July and December, respectively. This methodology is based on the hypothesis that these months have historically shown favorable trends for BXP’s stock performance.
This backtested strategy was initiated with a starting capital of $10,000 and spanned from January 2, 2004, to December 29, 2023. Over these 7301 days, the strategy was active only 17.48% of the time. This limited market exposure is a key feature of the strategy, as it aims to reduce risk by being selective and participating in the market during specific times that are statistically more likely to yield positive returns.
The strategy’s performance over the test period is noteworthy. From the initial $10,000 investment, the strategy’s equity reached a final value of $37,324.16, peaking slightly higher at $37,349.71. In terms of overall return, the strategy achieved a 273.24% increase, outpacing the buy and hold strategy’s return of 243.10% for the same period. When annualized, the strategy’s return stands at 6.82%, demonstrating a consistent upward trajectory over the long term.
It’s important to emphasize that this strategy was tested without factoring in the costs associated with commissions and slippage. While these costs could potentially impact the net returns, the exclusion of such fees in the backtest allows for a cleaner analysis of the seasonality effect on the stock’s performance.
The time frame of 19 years and the impressive returns highlight the potential of this seasonality-based strategy, offering a compelling case for its consideration in the array of trading strategies available to retail investors. By focusing on historically strong months for BXP and maintaining a disciplined approach to market entry and exit, this strategy provides a structured pathway to potentially enhance investment returns while mitigating exposure to market volatility throughout the year.

Key Performance Indicators
Investors navigating the stock market landscape are often keen to understand how their strategies perform over time. A critical aspect of assessing a trading strategy’s effectiveness is examining its key performance indicators (KPIs). In the case of the monthly seasonality trading strategy applied to Boston Properties, Inc. (BXP), we have a wealth of data to consider, highlighting the strategy’s historical backtesting performance.
The end result of the backtesting is a figure that many investors first glance at: the final equity. In this instance, the strategy bolstered the initial capital from $10,000 to an impressive $37,324.16. This is a substantial increase and showcases the potential of the strategy over the test period, which spans nearly two decades from January 2, 2004, to December 29, 2023. During this period, the equity’s peak, a momentary zenith in the value of the portfolio, touched slightly higher at $37,349.71.
The overall return generated by this strategy is a considerable 273.24%, which outpaces the buy and hold return of 243.10% for the same period. When we annualize these returns to adjust for the fact that the backtesting covers multiple years, the strategy still remains in good standing with an annualized return of 6.82%. This figure gives investors a normalized view of returns, making it easier to compare with other investment opportunities or benchmarks.
However, it is not just the absolute return that matters but also how these returns stack up when considering the volatility of the investment. In this case, the annualized volatility for the strategy stands at 14.56%. This is significantly lower than the volatility experienced by a simple buy and hold strategy for BXP, which has an annualized volatility of 38.65%. Lower volatility suggests that the investment’s value was relatively more stable over time, which could be preferable for risk-averse investors.
The Sharpe Ratio, a measure of risk-adjusted return, is 0.468 for our seasonality strategy, indicating that the excess return received per unit of volatility is reasonable, though still below 1, which would indicate a more favorable risk-adjusted return. Comparatively, the buy and hold approach yielded a Sharpe Ratio of just 0.169, a testament to the greater volatility and risk inherent in that method without a commensurate increase in return.
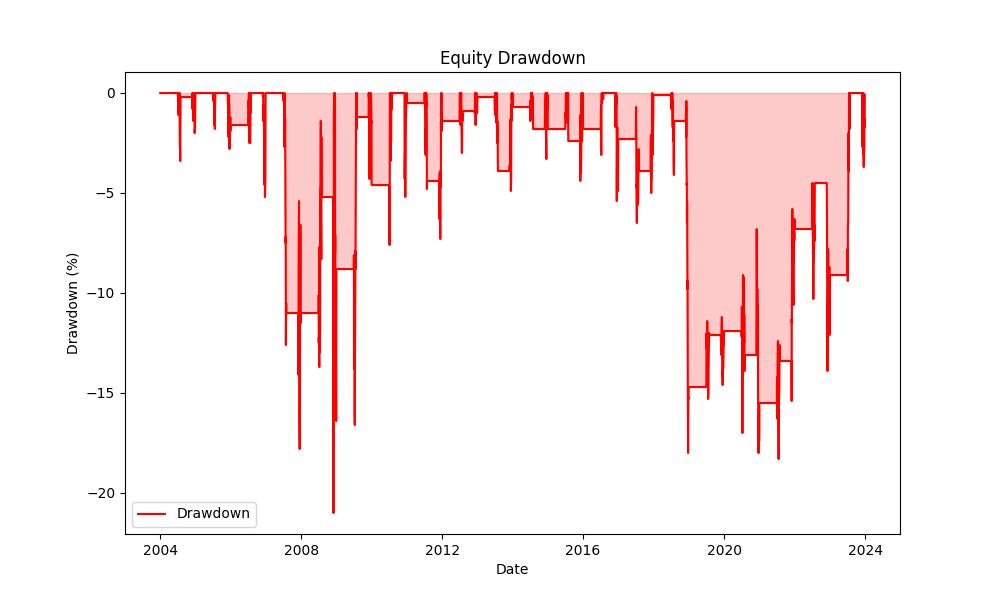
When discussing risk, it’s crucial to address the maximum drawdown experienced during the backtesting period. For our strategy, it was -20.96%, a measure of the largest drop from peak to trough in the strategy’s value. This is a significant improvement over the -72.73% maximum drawdown faced by a buy and hold investor, highlighting the strategy’s effectiveness in mitigating severe losses.
The average drawdown, which provides insight into the typical decline one might expect, was -2.85%, with these downturns lasting on average 83 days. In contrast, the average drawdown duration for the buy and hold method was shorter, at 57 days, but the average drawdown itself was deeper, at -3.85%.
These key performance indicators together present a narrative of a trading strategy that, while not without risks, offers a compelling case for investors looking for a seasonality-based approach to trading in the stock of Boston Properties, Inc. The strategy has historically provided solid returns, with reduced volatility and drawdowns compared to a passive investment approach.

Risk Management
When embarking on any investment strategy, understanding the associated risks is crucial to making informed decisions. The monthly seasonality trading strategy applied to Boston Properties, Inc. (BXP) reveals a nuanced risk profile that investors should carefully consider.
Firstly, let’s discuss annual volatility, which measures the degree of variation in trading prices over time. For this strategy, the annual volatility stands at 14.56%. Compared to the buy-and-hold approach’s volatility of 38.65%, the seasonality strategy presents a significantly lower fluctuation level. This suggests that the strategy may provide a smoother investment experience, as it is less exposed to the wide price swings that can characterize the real estate market.
The Sharpe Ratio, a tool that helps investors understand the return of an investment compared to its risk, is 0.468 for the seasonality strategy. While a Sharpe Ratio greater than 1 is often sought after, the context here is important. The buy-and-hold strategy yielded a Sharpe Ratio of only 0.169. This indicates that, on a risk-adjusted basis, the seasonality strategy has provided more favorable returns relative to the risks taken.
However, no strategy is without the potential for loss, and this reality is captured by the maximum drawdown, which reflects the largest peak-to-trough decline over the strategy’s duration. For the seasonality strategy, the maximum drawdown was -20.96%, occurring over a span of 1832 days. In contrast, the buy-and-hold strategy experienced a staggering maximum drawdown of -72.73%. Although the seasonality strategy’s drawdown is significant, it pales in comparison to the potential losses one might have sustained with a buy-and-hold approach during adverse market conditions.
Furthermore, the average drawdown for the seasonality strategy was -2.85%, with an average duration of 83 days. This indicates that while there may be periods of decline, they tend to be relatively shallow and short-lived, allowing for potential recovery without prolonged periods of devaluation.
Investors should also consider the seasonality strategy’s risk management in the context of its exposure time, which is only 17.48% of the total duration. This limited exposure to the market suggests a defensive posture, as the strategy is only active during specific periods thought to be advantageous, thereby potentially reducing the risk of loss during historically unfavorable times.

Trade Analysis
When exploring the intricacies of the stock market, insightful data such as backtesting results can be a beacon for investors. Diving into the performance of the monthly seasonality trading strategy for Boston Properties, Inc. (BXP), one can glean valuable insights into the practicalities and outcomes of following specified trading rules over nearly two decades.
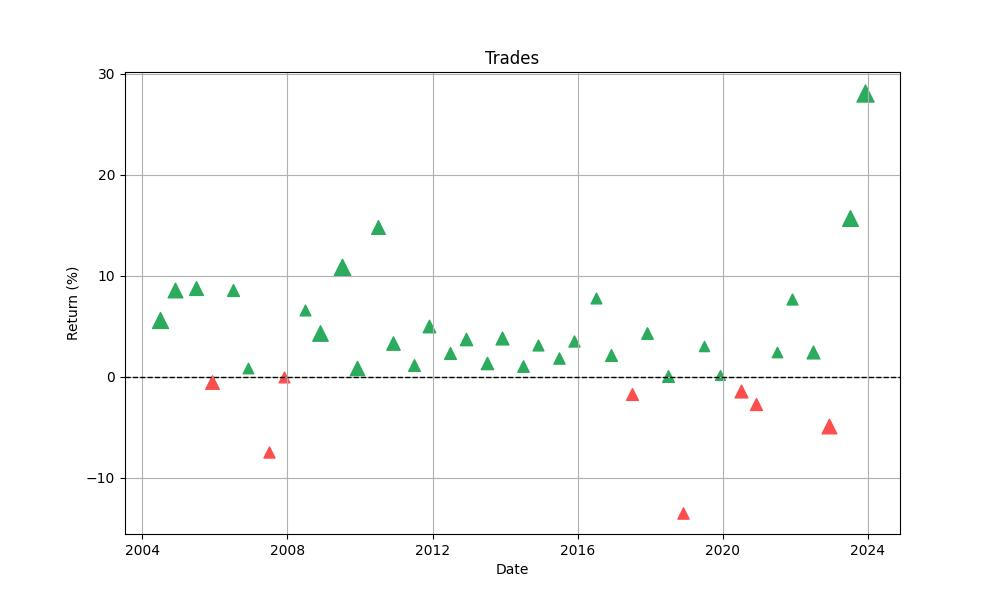
A total of 40 trades were executed during the backtesting period, adhering strictly to the strategy of taking long positions in the months of July and December. This approach yielded an impressive win rate of 80%, indicating that 32 out of the 40 trades were profitable. Such a high success rate is noteworthy and suggests a strong seasonal pattern in the equity’s performance during these months.
Among these trades, the best-performing single trade boasted a remarkable 28.10% return, showcasing the potential for significant gains when the strategy aligns with optimal market conditions. Conversely, the strategy was not immune to downturns, as evidenced by the worst-performing trade, which resulted in a loss of 13.49%. This highlights the inherent risks that accompany even the most statistically robust trading strategies.
The average trade outcome for this strategy was a gain of 3.35%, a figure that underscores the strategy’s ability to consistently generate positive results over time. Additionally, the duration of trades was relatively short, with the maximum trade duration being 33 days and the average trade lasting precisely 31 days. This quick turnover suggests that the strategy is designed to capitalize on short-term seasonal trends without overexposing the investor to market volatility.
The profit factor, a metric that measures the gross profits against the gross losses, stood at a commendable 5.41, indicating that the total gains were more than five times the total losses. This is a testament to the effectiveness of the strategy and its ability to tilt the balance sheet in favor of the investor.
Expectancy, which reflects the average amount an investor can expect to win or lose per trade, was positive at 3.55%. This percentage gives investors an idea of what to expect from each trade executed under the strategy, providing a baseline for potential future outcomes.
Analyzing these figures, retail investors can appreciate the practical aspects of the trading strategy, its historical performance, and what these numbers may mean for their investment decisions. The data presents a compelling case for the seasonality trading strategy with Boston Properties, Inc., showcasing robust returns, a high win rate, and a favorable risk-reward balance over the long term.

Conclusion
In conclusion, the monthly seasonality trading strategy for Boston Properties, Inc. (BXP) stands as a testament to the power of historical patterns and disciplined execution in the stock market. Over nearly two decades of rigorous backtesting, this strategy has outperformed the traditional buy-and-hold approach, delivering an impressive overall return of 273.24% with a reduced exposure to market volatility.
The strategy’s compelling performance metrics, including a lower annualized volatility, a reasonable Sharpe Ratio, and a significantly lesser maximum drawdown when compared to a buy-and-hold strategy, paint a picture of a robust investment approach tailored for risk-aware investors. With the added context of a high win rate and controlled average trade duration, the strategy further highlights the potential benefits of leveraging seasonal trends in the pursuit of investment growth.
While past performance is not a guarantee of future results, the data-driven insights from this strategy offer a valuable perspective for investors considering a seasonality-based approach. It underscores the importance of a methodical and analytical framework that can potentially mitigate risks and enhance returns. As the markets continue to evolve, the principles of seasonality remain an intriguing element for investors aiming to navigate the temporal ebb and flow of the stock market.


“Make the invisible visible. My goal is to shine a light on the subtle seasonal signals in the stock market, providing investors with the insight needed to make informed decisions. By breaking down the complexities of seasonality, I strive to empower our audience with knowledge and foresight, turning data into action.”

