


Introduction
In the intricate dance of the stock market, it’s not just about which stocks you pick; it’s also about when you choose to engage with them. As seasons change, so too can the performance of stocks, with certain times of the year historically showing distinct patterns of return. It’s here, in the rich tapestry of market seasonality, where astute investors can find unique opportunities to potentially enhance their portfolios.
Enter Clearway Energy, Inc., a company that’s not just riding the wave of the renewable energy boom, but helping to propel it forward. With an investment strategy that’s as timely as it is strategic, we explore the potential of harnessing the cyclical nature of the stock market to our advantage. But this isn’t a tale of mere guesswork or market speculation. Our narrative is grounded in over a decade of data, meticulous analysis, and disciplined execution.
As we unpack the essence of a monthly seasonality trading strategy tailored for Clearway Energy, we’re not just looking at numbers on a screen; we’re delving into the story of a carefully crafted approach designed to ride the crests of profitability when they’re most likely to occur. And while the promise of profit is alluring, we’re equally focused on navigating the risks—a journey not for the faint-hearted, but for the informed investor who seeks to understand the full spectrum of what’s at stake.
Join us as we embark on this journey, where wisdom meets timing, and where the strategic interplay of investment and calendar can potentially lead to fruitful outcomes. This is more than just a financial voyage—it’s a masterclass in the art of timing the market, a testament to the potential of aligning investment decisions with the ebb and flow of seasonal market trends.
Company Overview
CWEN Clearway Energy, Inc. stands as a renewable energy powerhouse, leading the charge towards a sustainable future. The company’s core business revolves around owning and operating utility-scale solar and wind facilities, generating clean electricity for communities across the United States.
CWEN’s target market encompasses utilities, municipalities, and corporations seeking reliable and cost-effective renewable energy solutions. Through long-term contracts, the company secures stable revenue streams while contributing to the decarbonization goals of its customers.
At the heart of CWEN’s value proposition lies its commitment to environmental stewardship. By providing renewable energy, the company helps reduce greenhouse gas emissions, mitigate climate change, and foster a healthier planet. Additionally, CWEN’s projects often create local jobs and economic opportunities, contributing to community development.
The company follows an asset-ownership model, meticulously selecting and developing high-quality renewable energy projects. CWEN maintains a disciplined approach to risk management, ensuring optimal performance and long-term value creation for its stakeholders.
CWEN’s growth strategy focuses on expanding its renewable energy portfolio through organic development and strategic acquisitions. The company actively pursues opportunities to enhance its geographic footprint, diversify its energy mix, and capitalize on emerging technologies within the renewable energy sector.
The renewable energy industry, in which CWEN operates, is experiencing robust growth driven by global decarbonization efforts, supportive government policies, and increasing demand for sustainable energy sources. As a leading player in this dynamic industry, CWEN is well-positioned to capture significant market opportunities and drive long-term shareholder value.
Strategy Overview
Clearway Energy, Inc. is a trailblazer in renewable and conventional energy generation and thermal infrastructure, offering investors an opportunity to engage with the burgeoning green energy market. The company’s focus on wind, solar, and natural gas facilities positions it at the forefront of the transition toward sustainable energy.
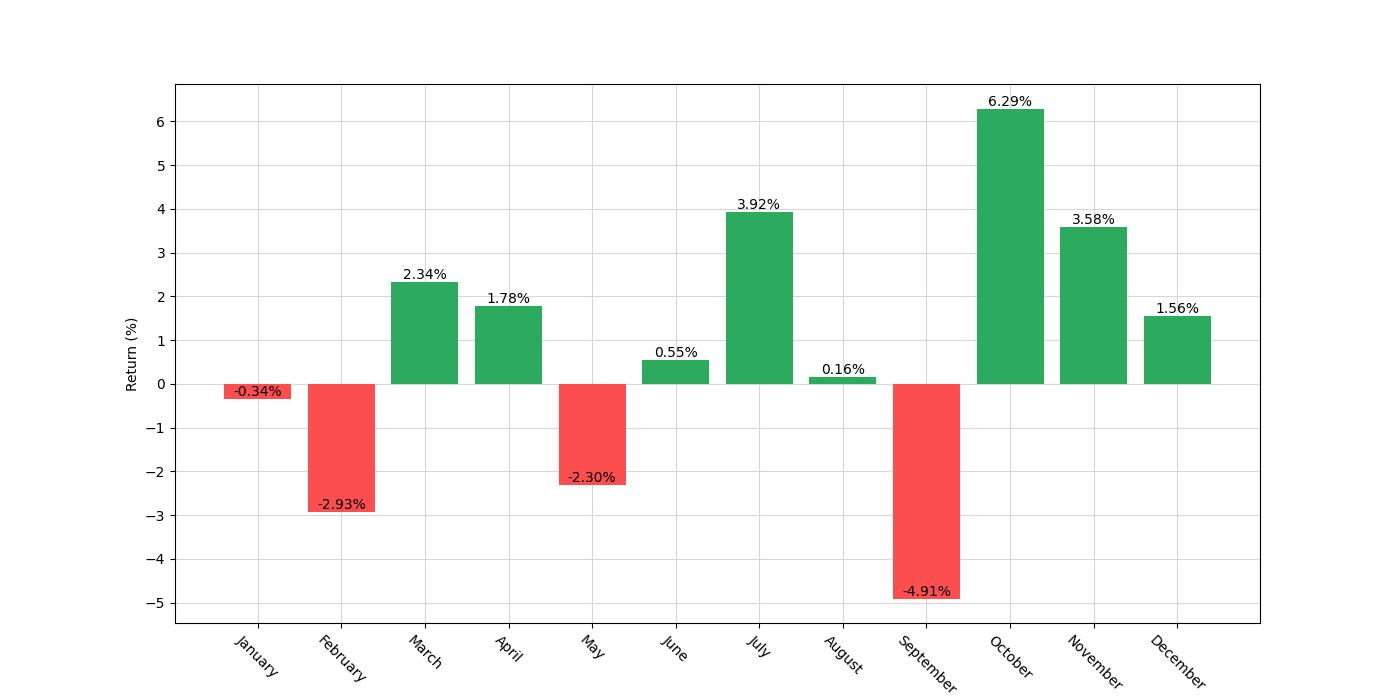
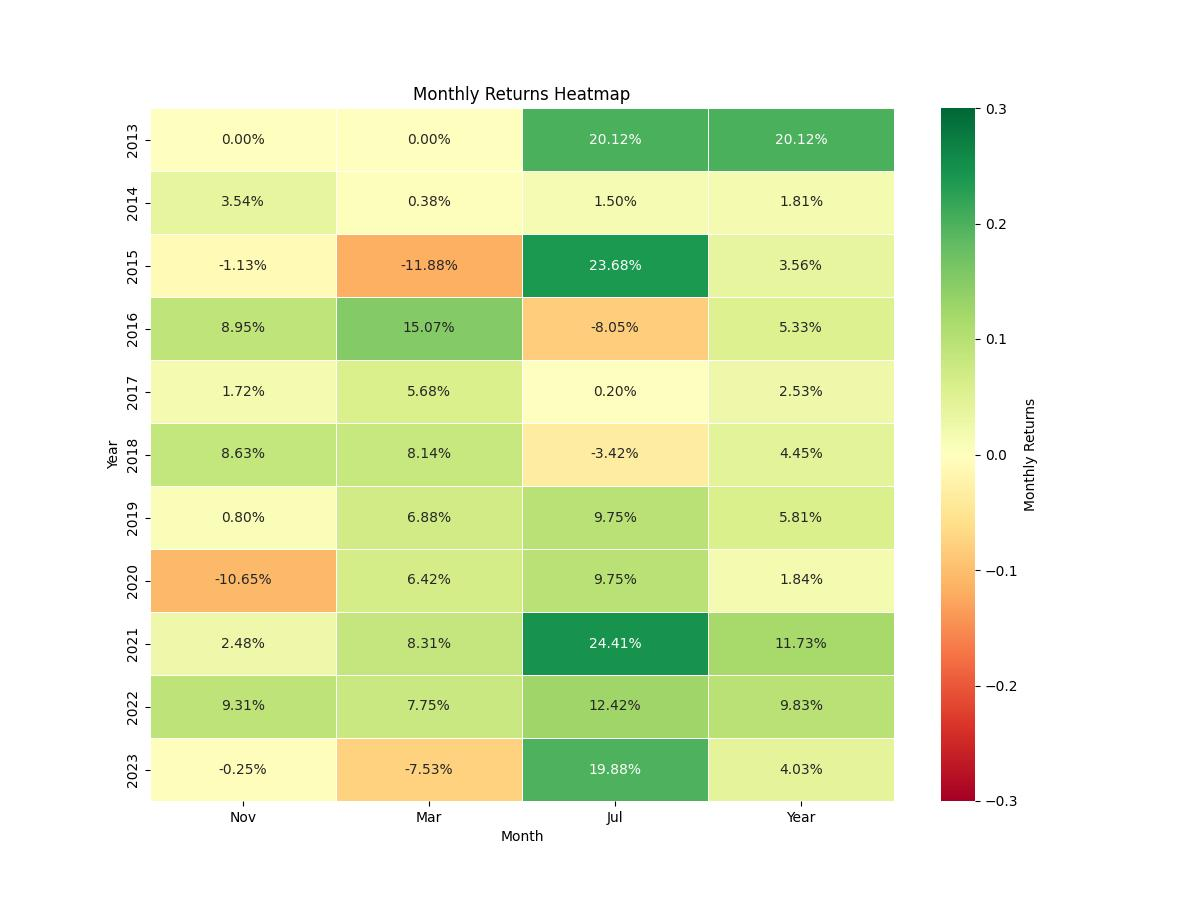
Investors have long sought ways to capitalize on the temporal patterns within the stock market, and a well-crafted monthly seasonality trading strategy may offer a compelling approach. The strategy in question is designed to exploit the historical tendencies of Clearway Energy’s stock performance based on monthly patterns. With an initial capital of $10,000, the strategy dictates taking a long position — that is, betting that the stock will rise — exclusively during the months of March, July, October, and November. This targeted approach is rooted in historical performance data which suggests these months have been favorable for Clearway Energy’s stock. It is important to note that the strategy does not call for short positions during any months, focusing solely on the periods deemed to be the most advantageous for growth.
This backtested strategy spans over a decade, beginning on July 17, 2013, and concluding on December 29, 2023. The duration of this analysis encapsulates 3,817 days of market activity, providing a robust data set for evaluating the efficacy of the seasonal approach. Throughout this period, the strategy dictated market exposure for approximately 35.32% of the time. This selective engagement with the market, based only on the specified months, is intended to reduce risk and enhance the potential for returns.
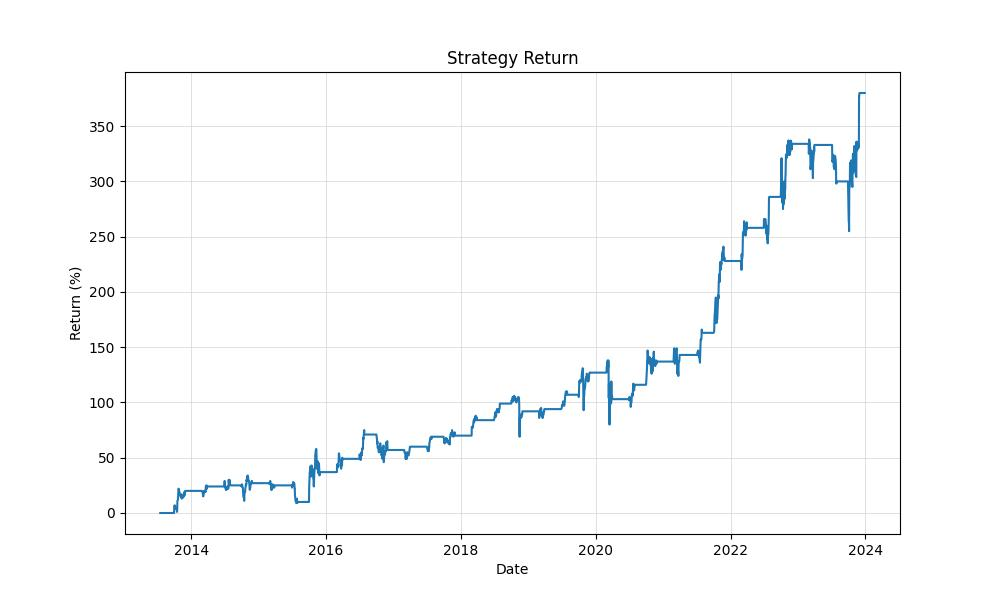
At the end of the backtesting period, the strategy’s equity final balance stood at a remarkable $47,968.39, a nearly fivefold increase from the initial capital. This peak equity figure is especially notable as it coincides with the final balance, indicating that the strategy did not experience a decline from its highest value at the conclusion of the testing period. In comparison to a buy-and-hold approach, the strategy’s return is significantly higher at 379.68%, dwarfing the buy-and-hold return of 66.55%. When annualized, the strategy’s return stands at 16.19%, a compelling figure that showcases the potential of leveraging seasonality in investment decisions.
Key Performance Indicators
Investing in the stock market is often a balance of art and science, with a dash of timing. Seasonality trading strategies harness the rhythm of the market, aiming to capitalize on historical patterns that occur during specific times of the year. Clearway Energy, Inc., a company known for its clean energy solutions, presents an intriguing case study for such a strategy.
From the starting gate in mid-July 2013 to the closing bell of December 2023, our strategy spanned over 3,800 days. During this period, the strategy was active for approximately 35% of the time, mirroring the seasonal approach that dictated entering long positions only during certain months—March, July, October, and November. This disciplined method provided an interesting contrast to the ‘buy and hold’ approach, which remained in play for nearly the entire duration.
The fruits of this strategic approach are evident when we examine the equity growth. From an initial investment of $10,000, the strategy’s equity burgeoned to an impressive $47,968. This final equity value not only marks the peak of capital accumulation but also signifies a return of nearly 380%. In comparison, a ‘buy and hold’ investor would have seen a more modest increase, with final equity standing at $16,364 and a return of about 64%.
Annualized returns add another layer to our understanding. The strategy yielded an annualized return of over 16%, a figure that robustly outperforms the ‘buy and hold’ annualized return of roughly 4.8%. This stark contrast highlights the potency of a well-defined seasonal strategy over a more passive investment stance.
When we consider these numbers, it’s important to remember that they don’t exist in a vacuum. They’re the product of a conscious choice to engage with the market at times when historical data suggests a higher probability of gain. By capitalizing on these seasonal trends, the strategy has clearly demonstrated its ability to outpace the steady, albeit slower, trek of a ‘buy and hold’ philosophy. It is this kind of strategic acumen, rooted in historical patterns and executed with precision, that can offer investors a tantalizing edge in the quest for stock market gains.
Risk Management
In the realm of investing, the adage “no risk, no reward” holds a kernel of truth, particularly in the context of stock market strategies. However, discerning investors are keen on not just the returns but the risks undertaken to achieve them. In the case of the backtested monthly seasonality trading strategy for Clearway Energy, Inc., the risk profile is as intriguing as it is instructive.
Let us first consider the annualized volatility, which stands at approximately 25.71%. This figure represents the strategy’s variation from its average returns over a year and is a telling gauge of the risk involved. To put it simply, a higher volatility suggests greater uncertainty and potential for wide swings in portfolio value. In contrast, the buy-and-hold approach for the same stock exhibits a notably higher annualized volatility of nearly 39.82%. This stark difference underscores a relatively smoother ride for investors who employ the seasonality strategy as opposed to a passive buy-and-hold stance.
When we examine the Sharpe Ratio, which adjusts returns for the risk taken (as measured by volatility), the seasonality strategy achieves a ratio of approximately 0.63. While this might not be considered exceptionally high in absolute terms, it does indicate that the excess return over the risk-free rate is somewhat commensurate with the risk incurred. For context, the buy-and-hold’s Sharpe Ratio is a mere 0.12, suggesting that the additional returns do not sufficiently compensate for the additional risk.
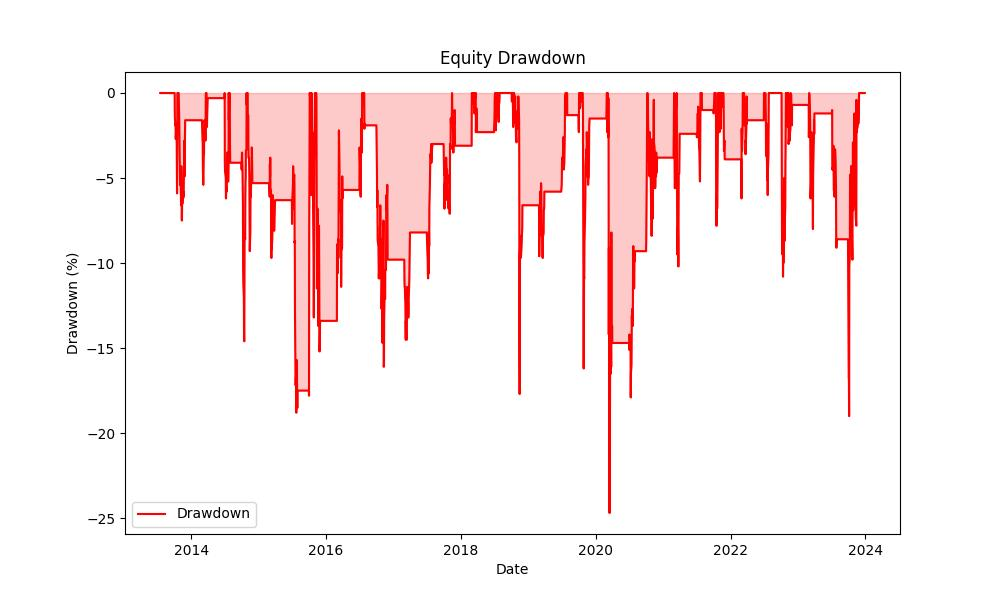
Another critical aspect of risk assessment is the maximum drawdown, which reflects the largest peak-to-trough drop in the investment value. For the seasonality strategy, this figure is roughly -24.66%, occurring over a span of 476 days. The average drawdown, a more frequent but less severe measure of dips, is around -4.82%, lasting on average 59 days. The buy-and-hold strategy, on the other hand, faced a gut-wrenching maximum drawdown of nearly -79.34%, with an average drawdown of -11.58%. These numbers paint a stark picture: the seasonality strategy not only limits losses during downturns but also recovers more swiftly than a passive investment approach.
Finally, it is crucial to gauge the strategy’s efficiency in risk-adjusted returns through other lenses, such as the Calmar Ratio, which relates the annualized return to the maximum drawdown. The seasonality strategy presents a Calmar Ratio of approximately 0.66, suggesting a reasonable balance between the returns earned and the maximum drawdown risk. In contrast, the buy-and-hold approach’s Calmar Ratio languishes at a paltry 0.06, signaling that the returns are much less justifiable when considering the depth of potential drawdowns.
In sum, the seasonality strategy’s risk management profile for Clearway Energy, Inc. appears to offer a more stable and efficient path to returns when compared to the traditional buy-and-hold method. The reduced volatility, more favorable Sharpe Ratio, and a less severe drawdown profile suggest that investors who are mindful of the risks—not just the rewards—might find this seasonal approach a compelling addition to their investment arsenal.
Trade Analysis
When delving into the world of trading strategies, the robustness of a strategy can often be gauged by dissecting its historical performance, trade statistics, and overall consistency. The monthly seasonality trading strategy for Clearway Energy, Inc. (CWEN) presents some compelling data points that underscore its potential value for investors.
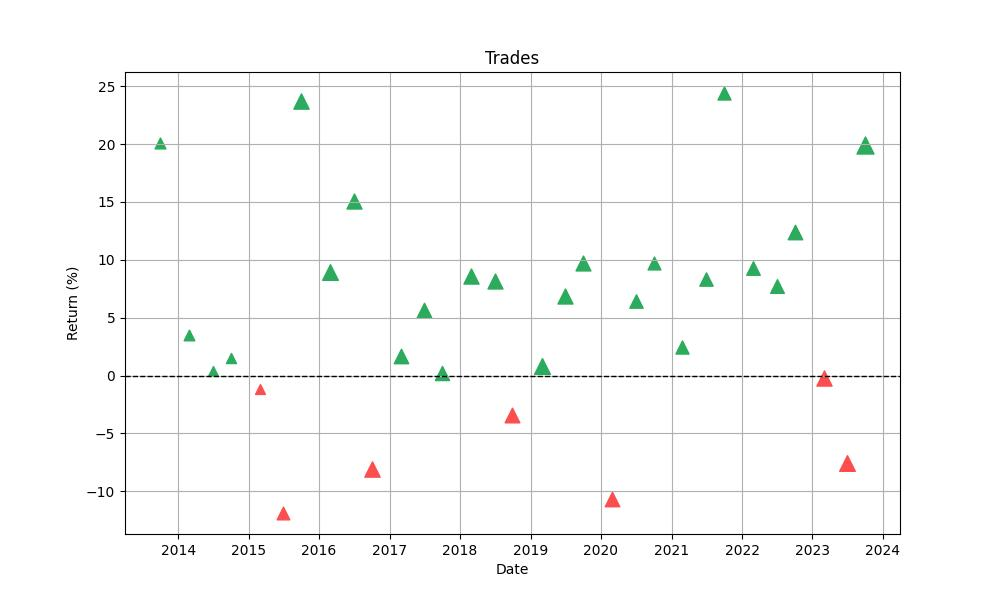
With 31 trades executed over the testing period, the strategy demonstrated a remarkable win rate of 77.42%. This high win rate indicates that the strategy was able to predict price movements with a high degree of accuracy, producing profitable outcomes in approximately three out of every four trades. This level of consistency is a strong indicator of the strategy’s reliability, making it an attractive proposition for investors who prioritize steady gains over high-risk, high-reward gambits.
The individual trade performance further reinforces the strategy’s merits. The best trade yielded an impressive 24.41% return, showcasing the strategy’s ability to capitalize on favorable market conditions. While even the best-crafted strategies are susceptible to market volatility and occasional losses, the worst trade recorded a limited downside of -11.88%. This loss is relatively contained, particularly when weighed against the potential for substantial gains.
On average, each trade under this strategy resulted in a 5.19% return, which is a robust figure given the short duration of each trade. The average trade duration was 42 days, with the longest trade spanning 63 days. A shorter duration limits exposure to long-term market fluctuations, which can be a double-edged sword but in this case, appears to have worked in the investor’s favor by harvesting short-term seasonal trends.
The Profit Factor, sitting at an impressive 5.03, provides further evidence of the strategy’s effectiveness. This metric, which is the ratio of gross profits to gross losses, suggests that the strategy is generating substantially more on winning trades than it is losing on the less frequent unsuccessful ones. A Profit Factor greater than one is generally considered good; a factor as high as 5.03 is an indicator of a very strong strategy.
The Expectancy of 5.58% is another statistic that stands out. This figure tells us that, on average, each trade is expected to yield a positive return of 5.58%. This is a critical metric for investors as it provides a long-term view of the strategy’s profitability.
Lastly, the System Quality Number (SQN) of 2.97 is a testament to the system’s soundness. The SQN is a measure of the strategy’s risk-adjusted return, taking into account the frequency and size of wins and losses, as well as the consistency of returns. A score above 2.5 is generally considered good, and anything above 3.0 is excellent, positioning this strategy in a favorable light.
Conclusion
As we wrap up our exploration of the monthly seasonality trading strategy for Clearway Energy, Inc., it’s clear that the approach has carved out a substantial edge over traditional investment methods. By strategically entering the market during historically profitable months and sidestepping the perceived underperformers, this strategy has delivered returns that speak volumes about the power of timing and historical precedent in the world of investing.
The robust performance of this strategy, as evidenced by a nearly fivefold increase in initial capital, a high win rate, and consistent trade outcomes, makes it a beacon for investors seeking to navigate the stock market’s ebb and flow. With risk management that has kept volatility and drawdowns in check, the strategy stands out as a well-rounded approach, balancing the pursuit of profit with the prudence of risk awareness.
In conclusion, the insights garnered from this decade-long analysis demonstrate that a seasonality trading strategy, when meticulously researched and executed, can provide a compelling alternative to a passive investment stance. For those investors looking to enhance their portfolios with a method that taps into the cyclical nature of the markets, the success of this strategy may offer a guiding light. It underscores the potential of leveraging seasonal trends, disciplined entry, and exit points, and a keen eye on risk management to achieve superior risk-adjusted returns. The journey through the past ten years of Clearway Energy’s stock behavior reinforces the time-honored lesson that in the markets, timing can be nearly as important as the investments themselves.

“Make the invisible visible. My goal is to shine a light on the subtle seasonal signals in the stock market, providing investors with the insight needed to make informed decisions. By breaking down the complexities of seasonality, I strive to empower our audience with knowledge and foresight, turning data into action.”