


Introduction
Welcome to the intricate dance of the stock market, where time itself plays a crucial role in the ebb and flow of share prices. As an investor, you’re constantly seeking edges in a world where every percentage point can be the difference between success and mediocrity. Today, we pull back the curtain on a fascinating facet of investing: the seasonality of stock markets and how harnessing this cyclicality can potentially lead to outsized returns.
In the financial symphony, timing is not just a component; it’s a soloist. And FTI Consulting, Inc., a leader in the global business advisory space, has shown us that its stock performance may just have a seasonal rhythm worth listening to. Imagine a trading strategy that doesn’t scatter its bets across the calendar year but waits for the right moment, like a surfer poised to catch the perfect wave during March, April, and November. This is the essence of strategic patience and precision.
But why these months, you may wonder? The answer lies in the meticulous analysis of historical data, revealing a consistent pattern of growth during these periods. The beauty of this approach is its simplicity and efficiency, allowing investors to potentially reap the rewards of market seasonality while minimizing exposure to the inherent risks of year-round trading.
This blog post isn’t just about a promising strategy; it’s about offering you an alternative perspective on investing. It’s about challenging the conventional wisdom of the buy-and-hold mantra with a method that’s been fine-tuned through nearly two decades of backtesting. Here, we don’t just tell you that the seasonal strategy outperformed the traditional approach; we show you by how much, and we delve into the numbers that matter.
So, whether you’re a seasoned investor or a curious newcomer, our exploration of FTI Consulting, Inc.’s seasonal strategy is more than a lesson in timing—it’s a gateway to understanding how the disciplined application of historical insight can lead to a compelling investment thesis. Join us as we decode the seasonality of stock markets and unveil a trading strategy that could change the way you view the calendar year.
Company Overview
FTI Consulting, Inc. (FCN) is a global business advisory firm offering expertise in various disciplines, including forensic and litigation consulting, corporate finance and restructuring, economic consulting, technology, and strategic communications. With over 6,400 employees in 28 countries, FTI Consulting serves a wide range of clients, from Fortune 500 companies to governments and law firms. Its revenue streams encompass consulting fees, expert witness fees, and transaction fees. FTI Consulting differentiates itself through its deep industry knowledge, experienced professionals, and a commitment to delivering exceptional client service. The company’s operational model emphasizes collaboration among its multidisciplinary teams to provide tailored solutions to complex business challenges. FTI Consulting’s growth strategy involves expanding its service offerings, enhancing its global presence, and leveraging technology to drive innovation. Operating in a highly competitive industry, FTI Consulting stands out with its reputation for integrity, its focus on client satisfaction, and its ability to adapt to evolving market needs.
Strategy Overview
FTI Consulting, Inc., a global business advisory firm, serves as the subject of our exploration into the world of stock market seasonality. Our focus is on a trading strategy that capitalizes on the cyclical nature of this company’s stock performance, specifically targeting the months that have historically shown distinct patterns of behavior.
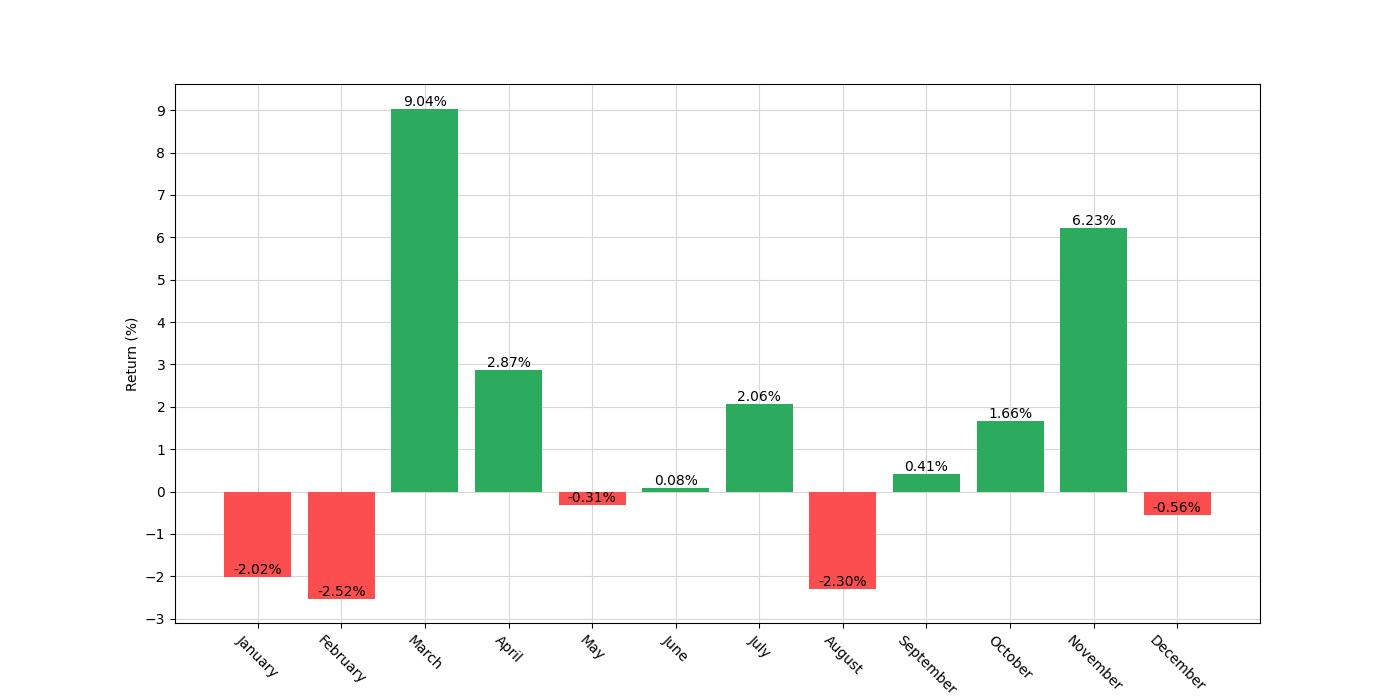
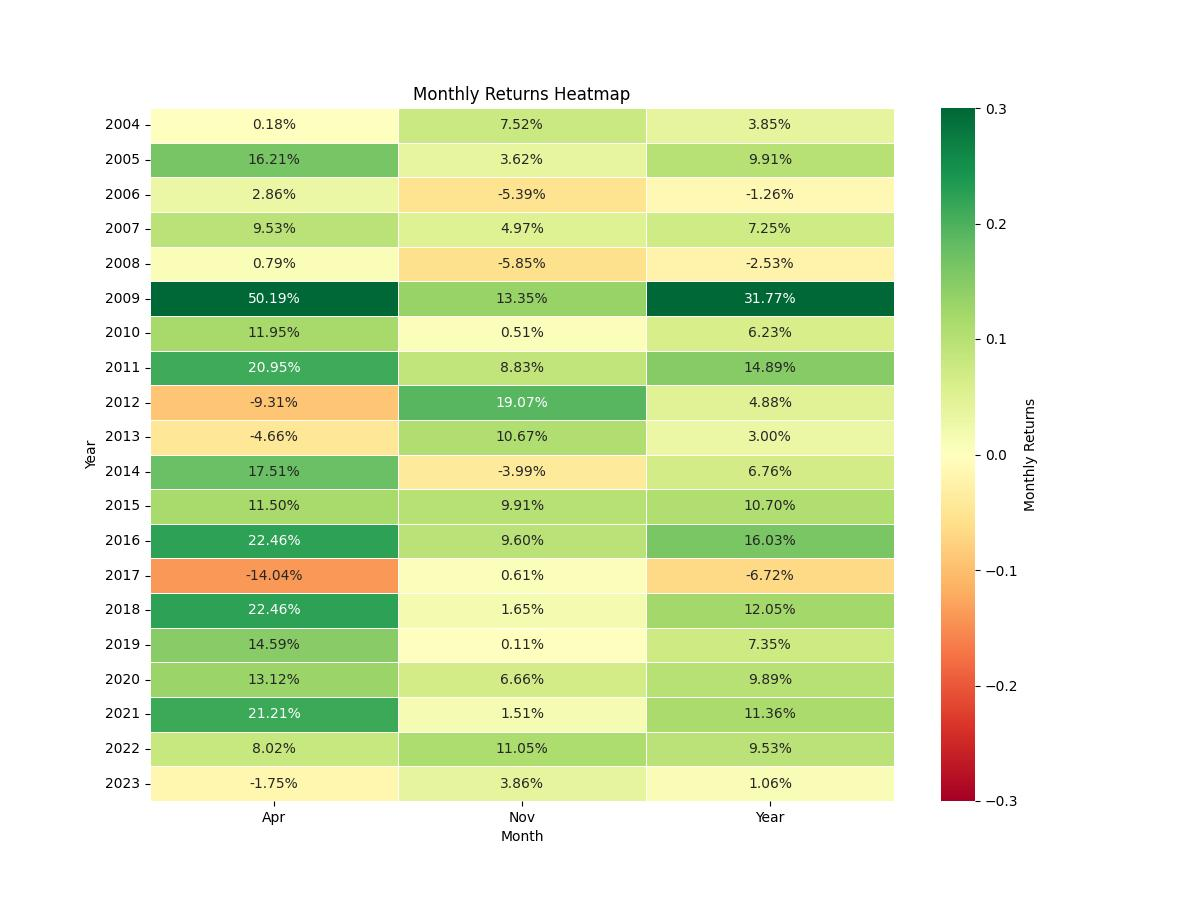
The strategy in question is simple yet intriguing. It operates on the premise that certain months tend to exhibit repeatable performance trends for FTI Consulting, Inc. Based on extensive backtesting, which spans nearly two decades from January 2, 2004, to December 29, 2023, an investment approach was devised that involves entering long positions exclusively during March, April, and November. These months were identified as periods when the stock typically experiences upward momentum. It’s worth noting that the strategy does not involve short positions in any month, suggesting that the downside during other periods may not be as pronounced or consistent.
For an individual investor with a starting capital of $10,000 and adopting this seasonal strategy, the exposure time to the market—meaning the percentage of the total time spent in active trades—was approximately 25.91%. This relatively low market exposure is a crucial aspect as it implies that the capital is not constantly at risk throughout the year, and yet the strategy aims to capture the most favorable periods.
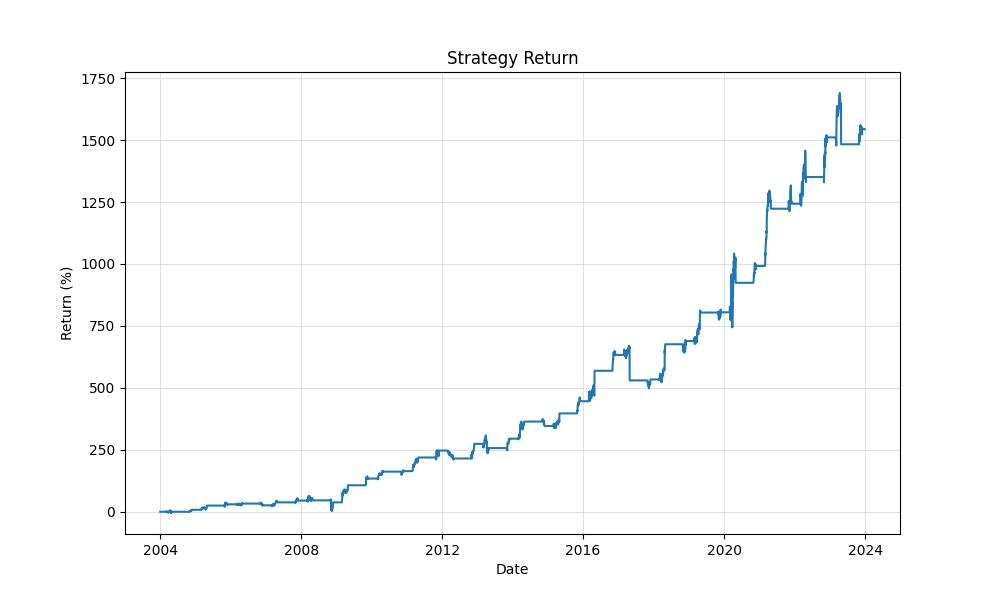
The backtesting results are compelling. This methodical approach to trading FTI Consulting, Inc. yielded an impressive final equity of $164,419.26, with the peak equity reaching $178,981.15. When we compare these figures to a simple buy-and-hold strategy over the same period, which would have grown the initial investment to $85,546.90, the advantage of the seasonal approach becomes evident.
Moreover, the percentage return on the seasonal strategy is a staggering 1544.19%, dwarfing the 742.78% return from a passive buy-and-hold investment. These returns are not just impressive in magnitude; they are also robust when annualized, boasting an annual return of 15.05% for the seasonal strategy, which comfortably surpasses the 11.35% annual return of the buy-and-hold approach.
This strategic framework, rooted in historical patterns, offers a fascinating alternative to the conventional buy-and-hold methodology. It demonstrates that with careful analysis and disciplined execution, seasonal tendencies within the stock market can be harnessed to potentially enhance investment outcomes. This strategy’s success over the backtested period paves the way for retail investors to consider seasonality as a factor in their trading decisions, especially when looking to optimize their exposure to the rhythms of the market.
Key Performance Indicators
In the realm of investing, the success of a trading strategy is measured by its ability to outperform simple, passive investment approaches. This is where the tale of FTI Consulting Inc.’s seasonal trading strategy unfolds, painting a picture of impressive financial growth over a span of nearly two decades.
The strategy’s performance is anchored by the substantial growth of the initial capital, which burgeoned from $10,000 to a remarkable $164,419.26. This figure stands tall when juxtaposed with the equity peak, which reached up to $178,981.15, indicating periods of exceptional profitability.
For those with an eye on the long-term journey, the overall return of the strategy is a testament to its efficacy. The strategy has delivered a staggering return of 1544.19%, a figure that stands more than double the buy & hold return of 742.78% over the same time frame. In simpler terms, the seasonal trading strategy didn’t just outpace the standard approach of holding the stock; it did so by a significant margin.
When we look at this performance on an annualized basis, the trading strategy boasts a return of 15.05% per annum. This percentage is a beacon of consistency, showcasing the strategy’s ability to leverage seasonal trends year over year. It also compares favorably to the annualized return of the buy & hold strategy, which is lower at 11.35%. Investors would note that not only has the strategy been profitable, but it has also provided a more accelerated growth trajectory compared to simply holding the stock.
In the dynamic landscape of the stock market, these figures are more than just numbers. They represent a disciplined approach to investing that capitalizes on specific, recurring temporal patterns in the stock’s performance. It’s the harnessing of these patterns that has allowed this strategy to thrive where others might simply follow the broader market.
Understanding these numbers provides investors with a clear insight into the potential of seasonal strategies and their place in a diversified investment portfolio. The robust returns and the marked improvement over a passive investment strategy underscore the value of strategic, informed trading decisions based on historical patterns and data-driven backtesting results.
Risk Management
When embarking on any trading strategy, understanding the inherent risks and how they are managed is vital for investors. One of the most telling indicators of risk in trading is volatility, which in the case of our seasonality strategy for FTI Consulting, Inc. (FCN) is annualized at 20.33%. This metric gives insight into the fluctuations an investor might expect over the course of a year. Compared to the annualized volatility of a buy and hold strategy for the same period, which stands at a much higher 39.56%, our seasonal approach appears to offer a smoother investment journey.
The Sharpe Ratio, a measure that indicates the average return per unit of volatility, stands at 0.74 for our seasonal strategy. This is a crucial figure as it demonstrates the additional amount of return an investor receives for every unit of increase in risk. In stark contrast, the buy and hold approach yields a Sharpe Ratio of only 0.29, indicating a less favorable risk-adjusted return.
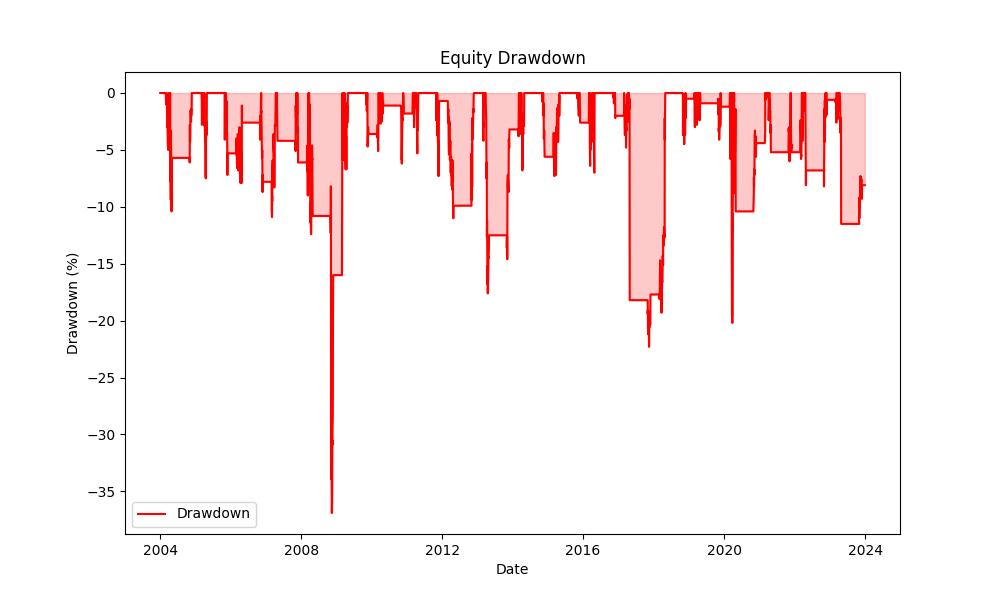
Delving deeper into the risk metrics, we evaluate the Max Drawdown, which signifies the maximum observed loss from a peak to a trough of a portfolio, before a new peak is attained. Our strategy’s Max Drawdown is reported at -36.89%, while the buy and hold method experienced a substantially more drastic Max Drawdown of -68.82%. The average drawdown, which is the average of the observed losses, also tells a story of lower risk in our strategy, sitting at -3.76% compared to -5.94% in the buy and hold scenario.
Furthermore, the duration of these drawdowns is equally telling. The maximum duration for which the seasonal strategy was in a drawdown was 519 days, whereas the buy and hold strategy was in a drawdown for a lengthy 3625 days. The average drawdown duration for our strategy is 53 days, significantly shorter than the 72 days in the buy and hold strategy, indicating that any losses were recovered more quickly, thus reducing the amount of time capital was tied up in a depreciated state.
These risk management parameters are essential in painting a picture of the resilience and sustainability of this seasonal trading strategy. They highlight not just the potential for returns but also the importance of understanding the path those returns might take, and the level of risk an investor would have to endure to achieve them. The seasonality strategy, with its lower volatility, superior risk-adjusted returns, and shorter drawdown periods, offers a compelling case for those looking to mitigate risk while capitalizing on market patterns.
Trade Analysis
Diving into the heart of our trading strategy, we meticulously scrutinized the performance of FTI Consulting, Inc. (Symbol: FCN) through a backtesting exercise that spanned nearly two decades, from the beginning of 2004 to the close of 2023. The data we’ve gathered paints a vivid picture of the strategy’s robustness and potential for investors.
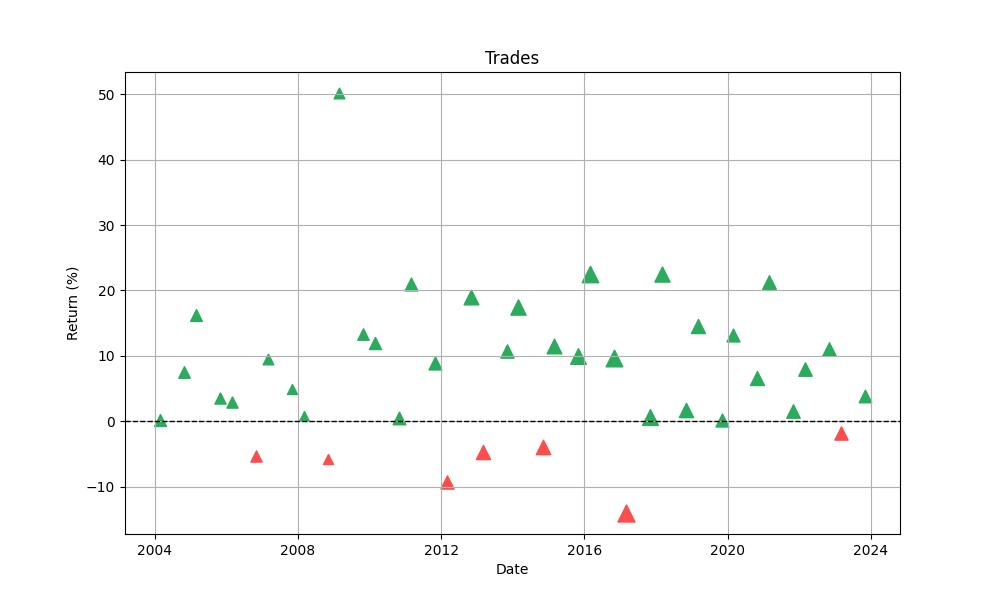
Over this period, the strategy dictated that we engage in a total of 40 trades based on our predefined monthly seasonality rules. This approach involved entering long positions exclusively during the months of March, April, and November. The sheer precision of this method is underscored by an impressive win rate of 82.5%, implying that more than four out of every five trades were profitable—a testament to the efficacy of seasonality in trading.
The fruits of these trades can be further appreciated when we look at the extremities of our trading outcomes. The best trade soared with a stellar 50.19% return, a figure that could be a game-changer for any investor’s portfolio. On the flip side, even the worst-performing trade, with a loss of 14.04%, was a manageable outcome given the high win rate and overall strategy performance.
The average trade yielded a heartening 7.26% return, which, when aggregated over the years, contributed significantly to the growth of the initial capital. This consistency in returns is further highlighted by the average trade duration of 46 days and a maximum trade duration of 63 days, suggesting that the strategy does not require locking in capital for extended periods to achieve its gains.
Another metric that stands out is the Profit Factor, which came in at an impressive 7.94. This ratio of gross profits to gross losses indicates that the strategy’s profits were nearly eight times the size of its losses, showcasing a compelling case for the efficiency of the strategy.
Lastly, the Expectancy of 7.80% provides a forward-looking perspective for investors. This figure represents the average amount one could expect to win (or lose) for every dollar risked over the long term. In our case, a positive expectancy suggests that each dollar invested is anticipated to yield an additional 7.8 cents on average, which is a robust indicator of the strategy’s potential profitability.
Taken together, these metrics not only demonstrate the effectiveness of the trading strategy but also reveal an attractive risk-reward profile that could be considered by retail investors looking to incorporate seasonality into their investment approach. Through disciplined adherence to the seasonal trading rules established, the strategy has navigated the ebb and flow of the markets with commendable success, as evidenced by the backtested results.
Conclusion
In conclusion, the comprehensive analysis of FTI Consulting, Inc.’s stock performance over nearly two decades reveals that a well-defined seasonal trading strategy has the potential to vastly outperform a traditional buy-and-hold approach. The strategy’s ability to identify and exploit predictable periods of stock gains has not only delivered impressive returns but has also done so with a lower exposure to market risk. The substantial final equity, the doubling of returns compared to buy-and-hold, and the favorable risk-adjusted performance metrics all underscore the validity and potential profitability of considering seasonality in investment decisions.
Moreover, the strategy’s robust risk management demonstrates its resilience, with lower volatility and shorter drawdown periods, offering investors a smoother and potentially less stressful investment experience. The backtesting results, characterized by a high win rate and short trade durations, further reinforce the strategy’s effectiveness and the value of precision in executing trades based on seasonal patterns.
The evidence presented in this analysis is a compelling argument for retail investors to weigh seasonality as a significant factor in crafting their trading strategies. While past performance is not indicative of future results, the disciplined application of a seasonality-based approach could well provide a strategic edge in navigating the complexities of the stock market. It is clear from our findings that with the right analysis, timing, and risk management, seasonality can be more than just a pattern—it can be a powerful ally in the quest for investment success.

“Make the invisible visible. My goal is to shine a light on the subtle seasonal signals in the stock market, providing investors with the insight needed to make informed decisions. By breaking down the complexities of seasonality, I strive to empower our audience with knowledge and foresight, turning data into action.”