


Introduction
In the ever-evolving tapestry of the stock market, the adage “timing is everything” takes on a profound significance. Seasonality, a pattern as rhythmic and predictable as the changing of the seasons, wields considerable influence over stock performance. Astute investors, always on the prowl for an edge, have long sought to decode these temporal patterns to enhance their trading outcomes. Enter the realm of monthly seasonality trading strategies, a domain where historical data lights the path to potential future gains.
At the heart of this intriguing investment landscape is Valvoline Inc. (VVV), a stalwart in the automotive lubricant sector, whose stock ebbs and flows with the calendar months in a dance of supply, demand, and investor sentiment. The strategy spotlighted here is more than a mere set of instructions; it is the distillation of historical performance into actionable intelligence. By adopting a tactical stance during select months, investors aim to harness Valvoline Inc.’s seasonal strengths and skirt its predictable periods of weakness.
The simplicity of the strategy belies the meticulous research and analysis fueling its creation. It embodies the quintessence of strategic foresight—capitalizing on the right moments while stepping aside to avoid potential pitfalls. Such an approach, grounded in empirical backtesting and measured against the gold standard of a buy-and-hold strategy, offers a compelling narrative of outperformance that beckons the investor’s gaze.
As the journey through this strategy unfolds, one cannot help but marvel at the confluence of data and discipline that forms the core of seasonal trading. It’s an invitation to investors—seasoned and novices alike—to consider the temporal dimension of their portfolio, to look beyond the static and embrace the dynamic. So, let the exploration begin, as we delve into the intricacies of a strategy that turns the calendar into a framework for financial growth.
Company Overview
Valvoline Inc.: A Lubricant and Automotive Services Leader
Valvoline Inc., a leading global supplier of premium branded lubricants and automotive services, has been delivering innovative products and expert services for over 150 years. With a rich history and a commitment to delivering high-quality solutions, Valvoline caters to a diverse customer base, including consumers, commercial businesses, and industrial operations. The company’s core products include a wide range of motor oils, transmission fluids, coolants, and greases, designed to meet the demands of modern vehicles and machinery. Valvoline’s target market encompasses various industries, including automotive, transportation, construction, and manufacturing. Its revenue streams flow primarily from the sale of its branded lubricants and the provision of automotive maintenance and repair services through its extensive network of franchised and company-owned service centers. Valvoline’s value proposition lies in its commitment to delivering superior protection, performance, and reliability for its customers’ vehicles and equipment. The company’s operational model involves the production, marketing, and distribution of its products, as well as the operation of its service centers. Valvoline’s growth strategy centers around expanding its product offerings, enhancing its distribution network, and increasing its brand presence globally. The industry analysis highlights increasing demand for high-performance lubricants, growing vehicle ownership rates, and the rising popularity of do-it-yourself maintenance, all of which contribute to Valvoline’s continued success.
Strategy Overview
Investors seeking to optimize their portfolios often look to strategies that can leverage patterns and rhythms in the marketplace. One such approach that has caught the attention of savvy market participants is the monthly seasonality trading strategy applied to Valvoline Inc. (Symbol: VVV), a company known for its automotive lubricants and services. This particular strategy involves initiating long or short positions in specific months based on historical performance data.
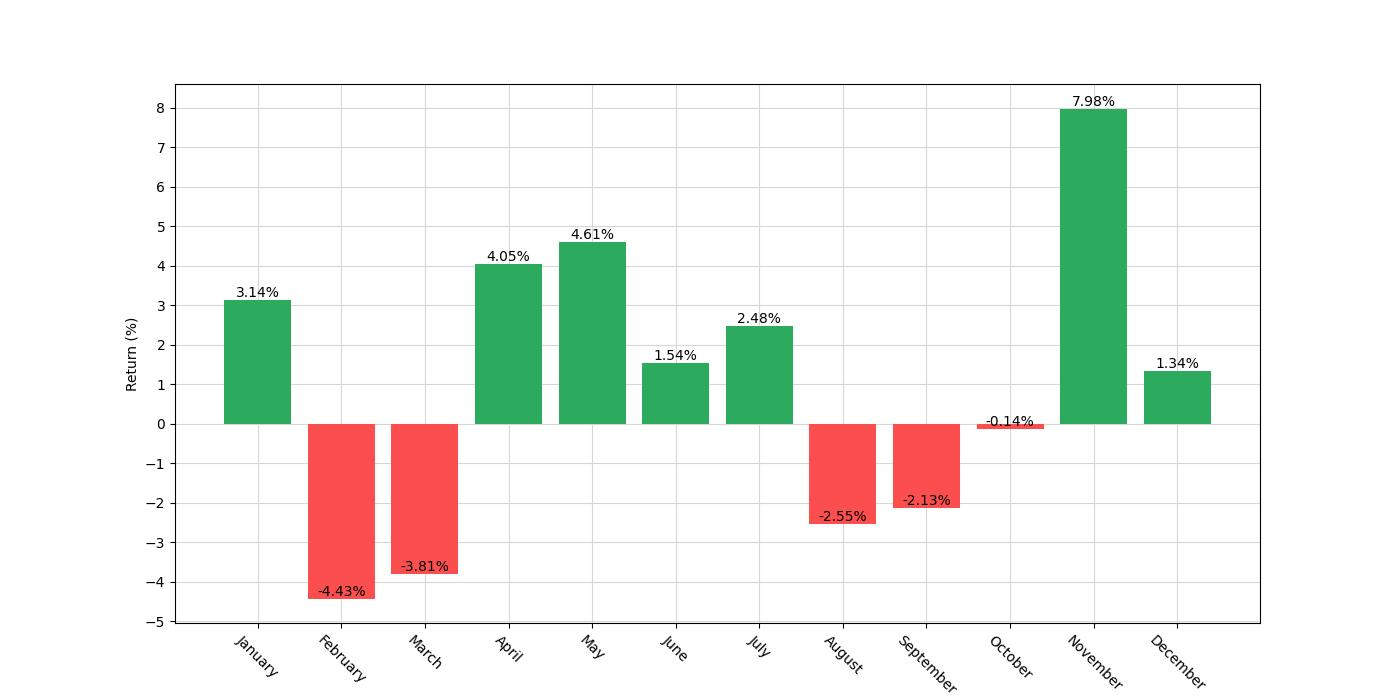
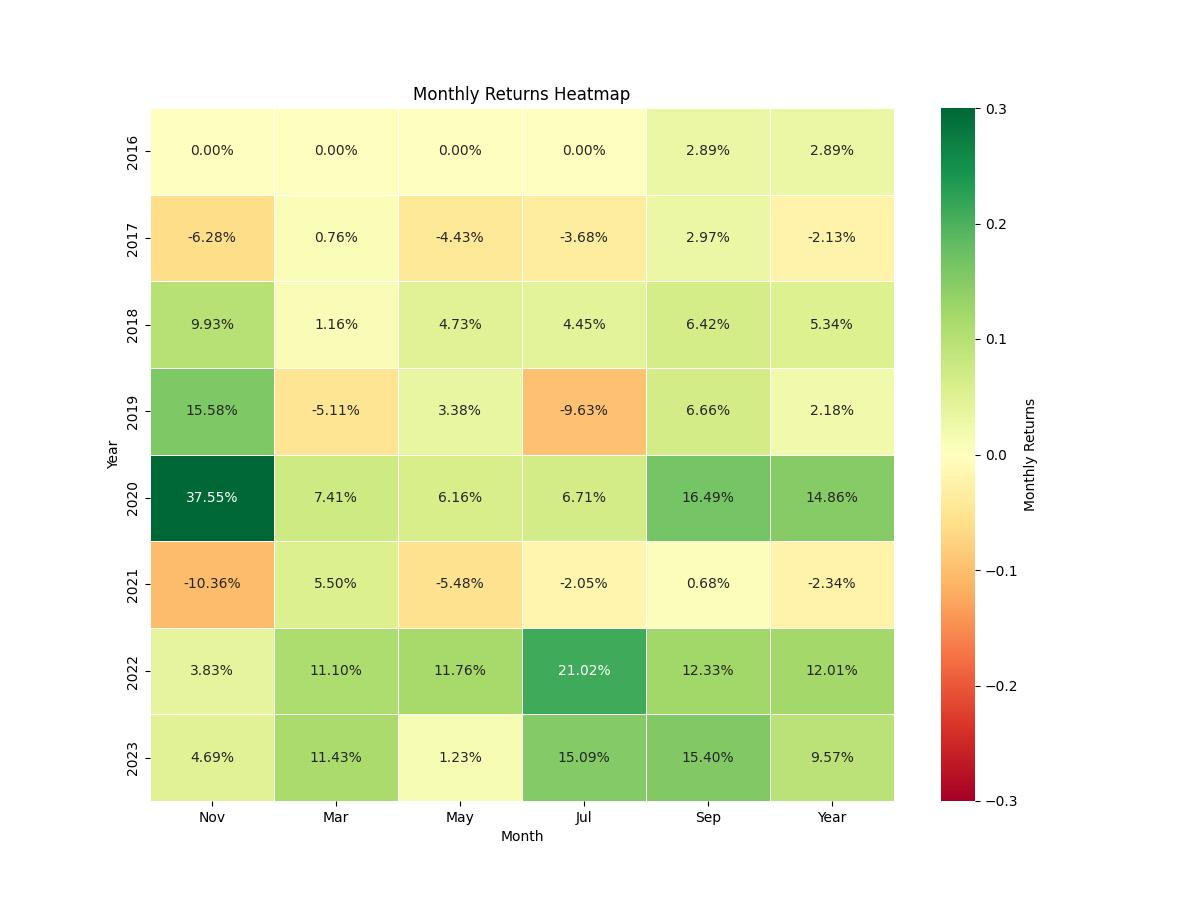
The strategy is straightforward in its execution: investors enter a long position during the months of May, July, and November, and conversely, take a short position in February, March, August, and September. The rationale behind this approach is to capitalize on recurring price movements that typically happen during these months. It’s important to note that this strategy does not factor in transaction costs such as commissions or potential slippage, which could affect real-world returns.
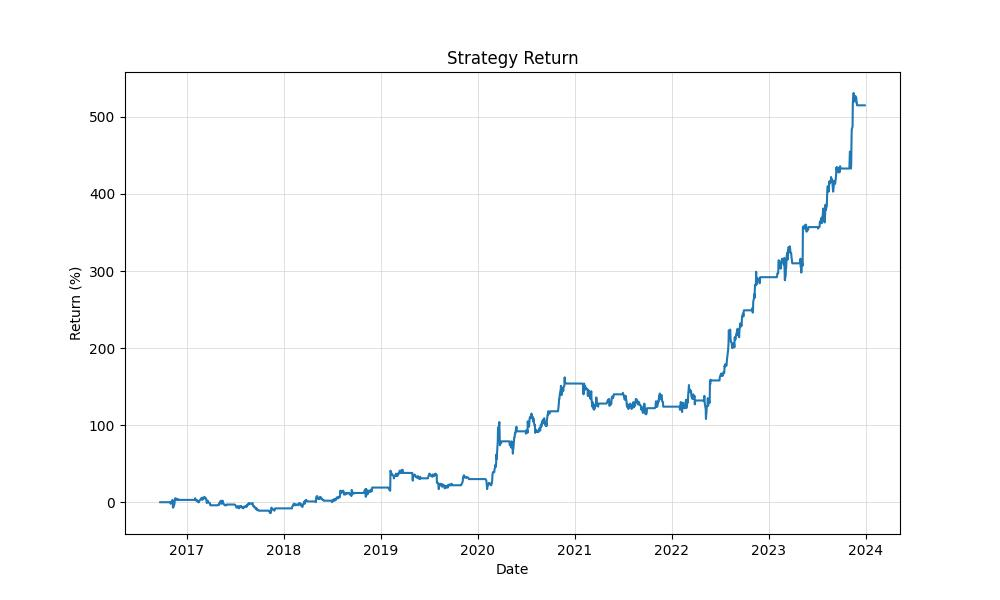
Our backtesting of this strategy spans from September 23, 2016, to December 29, 2023, a total of 2653 days. Within this period, the strategy was active approximately 58.94% of the time. This exposure time indicates that the strategy does not require a constant position in the market, allowing for periods when capital is not at risk in Valvoline Inc.’s stock.
The initial capital allocated for this strategy was $10,000. Over the backtest duration, this approach has demonstrated an impressive transformation of the initial stake, with the equity in the account reaching a final value of $61,487.29 and even touching a peak of $63,066.89. When we compare this to a simple buy-and-hold strategy over the same period, the seasonality strategy has outperformed significantly. The return on investment for the seasonal approach logged in at an astounding 514.87%, dwarfing the buy-and-hold return of 80.42%.
When annualized, these returns paint an even more compelling picture. The annualized return for our seasonal strategy stood at 28.43%, which is a stark contrast to the annualized return of 8.05% for the buy-and-hold strategy. This stark outperformance suggests that the strategy not only capitalized on the right months to be positioned in the market but also avoided downturns effectively.
Key Performance Indicators
When evaluating the effectiveness of a trading strategy, it’s paramount to look at how it stacks up against a simple buy-and-hold approach. For Valvoline Inc., a well-known provider of automotive lubricants and chemicals, the monthly seasonality trading strategy presents some compelling numbers that demand our attention.
Firstly, the final equity position reached an impressive $61,487.29, a substantial increase from the initial capital of $10,000. This final figure represents the closing balance after the last trade was completed, highlighting the capital growth over the backtesting period. Even more striking is the equity peak at $63,066.89, indicating the highest value the account reached at any point during the trading strategy’s execution.
The overall return generated by this strategy is a staggering 514.87%, which significantly overshadows the buy-and-hold return of 80.42%. To put this in perspective, a buy-and-hold approach would have yielded a respectable 80% return over the same period, but the seasonality strategy outperformed this by more than six times.
When annualized, the returns paint a more nuanced picture of the strategy’s performance. The trading strategy brought in an annualized return of 28.43%, a robust figure that suggests a strong performance year on year. In contrast, the annualized return for the buy-and-hold method stands at a lower 8.05%, which, while still positive, doesn’t compete with the active trading strategy’s results.
The difference in performance between the two approaches can be attributed to the strategic timing of entering and exiting positions based on historical monthly patterns. By capitalizing on the specific months that have historically shown bullish or bearish tendencies for Valvoline Inc., the strategy was able to enhance returns beyond what a passive investment approach could achieve.
This active management and timing of trades, however, comes with its own set of risks and volatility. But even here, the seasonality strategy holds its ground. Despite the inherent risks associated with an active trading strategy, the annualized volatility of this approach stands at 31.09%, which, while higher than what some conservative investors might prefer, still indicates a relatively stable performance pattern when taking into account the significant returns achieved.
Furthermore, the Sharpe ratio, a measure of risk-adjusted return, is at 0.91 for the trading strategy. This number suggests that the additional risk taken by the investor was adequately compensated by the returns. Although not exceedingly high, a Sharpe ratio close to 1 is generally considered acceptable, indicating that the excess return is just about equal to the additional risk when compared to a risk-free asset.
Risk Management
Navigating the stock market’s fluctuations requires not just an understanding of when to enter and exit positions but also an acute awareness of the risks involved. To manage these risks effectively, investors must consider a variety of indicators that paint a picture of the strategy’s risk profile.
One such indicator is the strategy’s annualized volatility, which stands at 31.09%. This number reflects the degree to which the strategy’s returns can be expected to fluctuate over time. Compared to the broader market, a higher volatility might suggest larger swings in performance, both positive and negative. For the strategy in question, this level of volatility indicates that while there may be significant ups and downs, the potential rewards have historically outweighed the risks, as evidenced by the strategy’s robust annual return of 28.43%.
The Sharpe Ratio, which measures risk-adjusted returns, further elucidates this point. With a ratio of 0.91, the strategy demonstrates that each unit of risk taken has historically resulted in a commensurate level of return. This ratio, which is often used to compare the performance of different investments, suggests that the strategy has managed to deliver healthy returns when considering the volatility it has experienced.
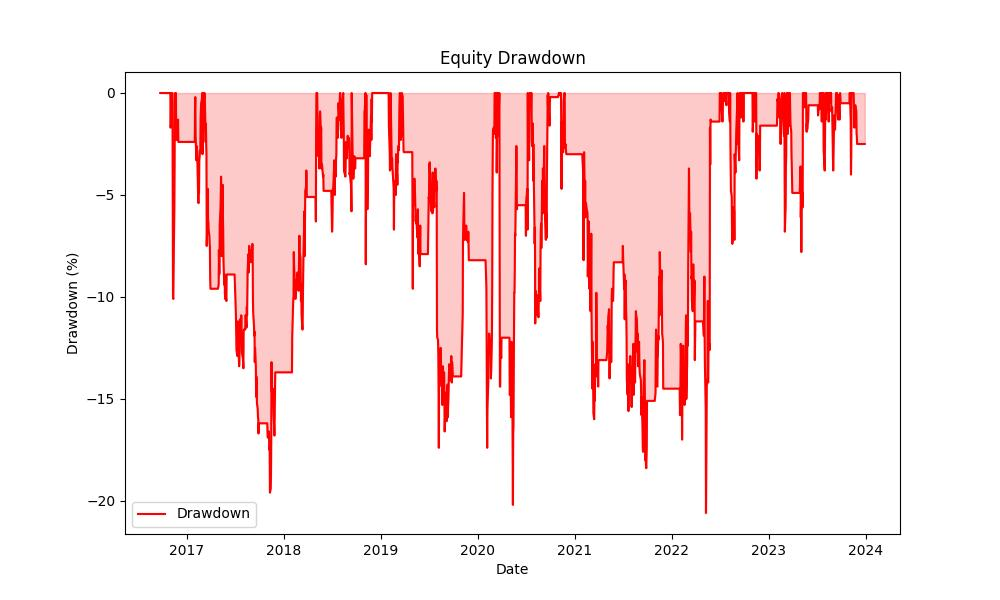
Addressing the potential losses an investor might face, the strategy’s maximum drawdown is recorded at 20.60%, which marks the largest peak-to-trough decline over the backtesting period. This figure is crucial as it gives investors a sense of the most significant loss that could have been experienced during the strategy’s worst period. It’s a testament to the strategy’s resilience that the average drawdown was much lower, at 3.99%, indicating that typical dips in value were relatively modest.
The duration of these drawdowns is also telling. The longest duration a drawdown lasted was 584 days, while on average, they lasted only 41 days. These durations provide insight into the strategy’s recovery time from losses, with a shorter average duration suggesting that the strategy is capable of rebounding from losses relatively quickly.
The effective management of risk is further illustrated by comparing these figures with the buy-and-hold approach, which experienced a maximum drawdown of over 62%, indicating that the trading strategy in question not only provided higher returns but also did so with less severe losses.
Trade Analysis
Diving deep into the mechanics of the trading strategy employed for Valvoline Inc. (VVV), it’s essential to understand how the strategy has performed over a series of trades. It’s not just about the number of trades made but also about the quality and consistency of the results.
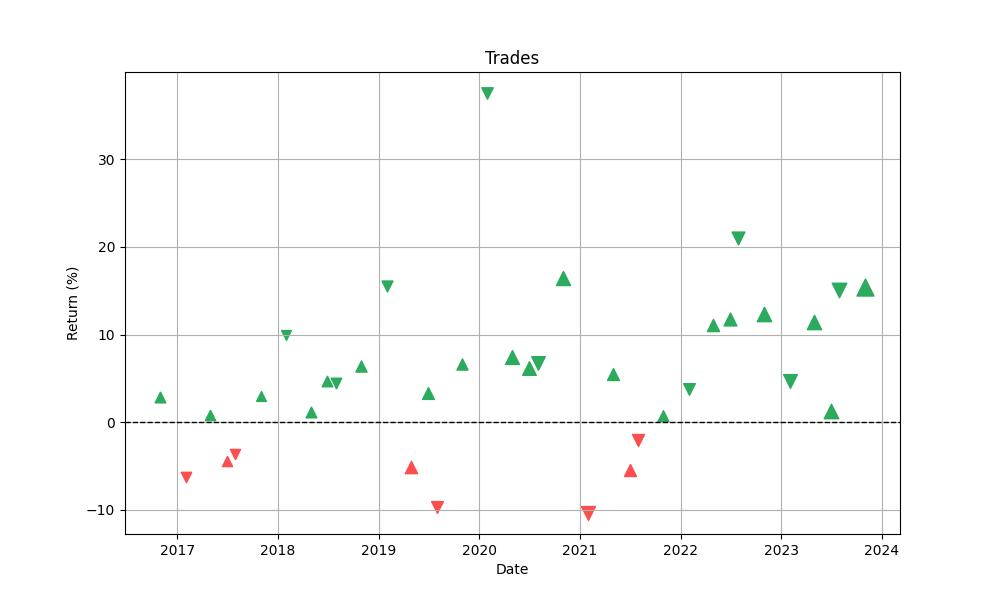
The backtest, covering a period from September 2016 to December 2023, comprised a total of 36 trades. This figure might not seem overwhelming, but it’s the success rate of these trades that stands out. An impressive win rate of approximately 77.78% indicates that the strategy has a high probability of predicting profitable entry points based on the selected seasonal months.
A closer look at the best and worst trades can provide insights into the strategy’s potential range of outcomes. The best trade yielded a remarkable 37.55% return, which is an excellent result by any standard and could be a game-changer for an investor’s portfolio. On the flip side, the worst trade resulted in a loss of 10.36%, underscoring the importance of risk management and the reality that not every trade can be a winner.
The average trade produced a return of about 5.18%, which is a solid figure, especially when compared to traditional investment returns. Moreover, consistency is key, and the average trade duration of 43 days coupled with a maximum trade duration of 63 days suggests that the strategy does not require locking in capital for excessively long periods. This aspect of the strategy could be particularly appealing to retail investors who value liquidity.
When evaluating the efficiency of a trading strategy, two metrics that stand out are the Profit Factor and Expectancy. A Profit Factor of approximately 5.26 is a strong indicator that the gains from winning trades substantially outweigh the losses from losing trades. Expectancy provides an average value of what traders might expect to make (or lose) per trade in percentage terms. Here, the strategy boasts an Expectancy of about 5.56%, reinforcing the potential for positive returns over time.
Understanding these figures is vital for investors considering the adoption of this seasonal trading strategy for Valvoline Inc. The backtesting results suggest a well-thought-out approach that could potentially yield handsome returns while maintaining a balance between exposure time and market risk. As investors, it’s this kind of analysis that can inform decisions and help tailor individual investment strategies to align with personal risk tolerance and financial goals.
Conclusion
In conclusion, the monthly seasonality trading strategy for Valvoline Inc. presents a compelling case for investors looking to enhance their returns by capitalizing on historical market patterns. With a staggering 514.87% total return and a robust annualized return of 28.43%, the strategy has demonstrated its ability to outperform a passive buy-and-hold strategy by a significant margin. Moreover, the high win rate of trades, combined with the strategy’s efficient risk management, as evidenced by a maximum drawdown significantly less than that of the buy-and-hold approach and a respectable Sharpe ratio, suggests that the additional risks assumed by investors have been well compensated.
The backtesting results underscore the potential of the seasonal strategy to achieve substantial capital growth, with key performance indicators painting a picture of both the risks and rewards. The impressive final equity position, the high success rate of trades, and the short average duration of drawdowns further illustrate the viability of this approach. While the higher annualized volatility might not suit all investor profiles, the historical data indicates a balance between the strategy’s exposure time and market risk, which could be attractive to those willing to accept greater fluctuations in pursuit of higher returns.
Ultimately, the seasonal trading strategy for Valvoline Inc. has proven to be more than just a theoretical construct. It has shown real-world applicability and success over the backtested period. However, investors must remember that past performance is not indicative of future results and should always consider their risk tolerance and investment goals when evaluating any trading strategy. The data and analysis provided here serve as a strong foundation for those considering a seasonal approach to the stock market, but as with all investment decisions, due diligence and a clear understanding of potential market changes and their impacts on the strategy are crucial.

“Make the invisible visible. My goal is to shine a light on the subtle seasonal signals in the stock market, providing investors with the insight needed to make informed decisions. By breaking down the complexities of seasonality, I strive to empower our audience with knowledge and foresight, turning data into action.”