


Introduction
As the leaves change color and the crisp air of autumn gives way to the frosty whispers of winter, so too does the stock market exhibit its own seasonal patterns, ripe for the savvy investor to decipher. The rhythm of the market, while complex, moves with a certain predictability that, when understood, can be the key to unlocking considerable returns. In this blog, we will not merely skim the surface of seasonal stock trends but dive deep into the case of Etsy, Inc., unraveling how a strategy that harnesses the clockwork of the calendar can outshine the static buy-and-hold approach.
Our analysis is rooted in a meticulous exploration of historical data, teasing out the nuances of a monthly seasonality trading strategy that has stood the test of time. We will guide you through a backtesting odyssey that starts in the spring of 2015 and journeys to the close of 2023, providing a comprehensive view of how strategic investments during specific months can lead to remarkable growth, far outpacing traditional investment methods.
This is not just a tale of growth but one of strategic timing and disciplined risk management. We will explore how a relatively modest involvement in the market can yield outsized returns, all the while maintaining a balance between risk and reward that could make even the most cautious investor take pause. Join us as we dissect the mechanics of a seasonal strategy that has transformed an initial stake into a small fortune, and understand the key principles that can help you navigate the cyclical waves of the stock market with poise and confidence.
Company Overview
Etsy, Inc., an online marketplace, connects global communities of buyers and sellers to discover vintage, handmade, and unique items. Its core services encompass a diverse selection of handmade and vintage products, including art, jewelry, clothing, home décor, and more. Etsy primarily serves individuals seeking distinctive items and connects them with creative entrepreneurs pursuing their passions. The company generates revenue through transaction fees, a percentage of sales, and advertising services. Its value proposition lies in fostering a vibrant platform that empowers small business owners and enables them to reach a broad customer base. Etsy’s operational model focuses on curating a user-friendly marketplace, utilizing technology to facilitate seamless transactions, and bolstering seller support. The company’s growth strategy involves expanding into new markets, diversifying product offerings, and enhancing the overall user experience. Industry analysis reveals a rapidly growing e-commerce landscape, with Etsy well-positioned to capitalize on the shift towards online shopping and the increasing demand for unique, handcrafted products.
Strategy Overview
Embarking on the journey of stock market investing, astute traders often seek to decode the rhythms of the market to capitalize on its ebb and flow. A particular approach that has piqued the interest of many is the utilization of seasonal trends to inform trading decisions. In this vein, we’ve delved into a strategy focused on the performance of Etsy, Inc., a company renowned for its online marketplace that connects creative entrepreneurs with consumers seeking unique, handcrafted goods.
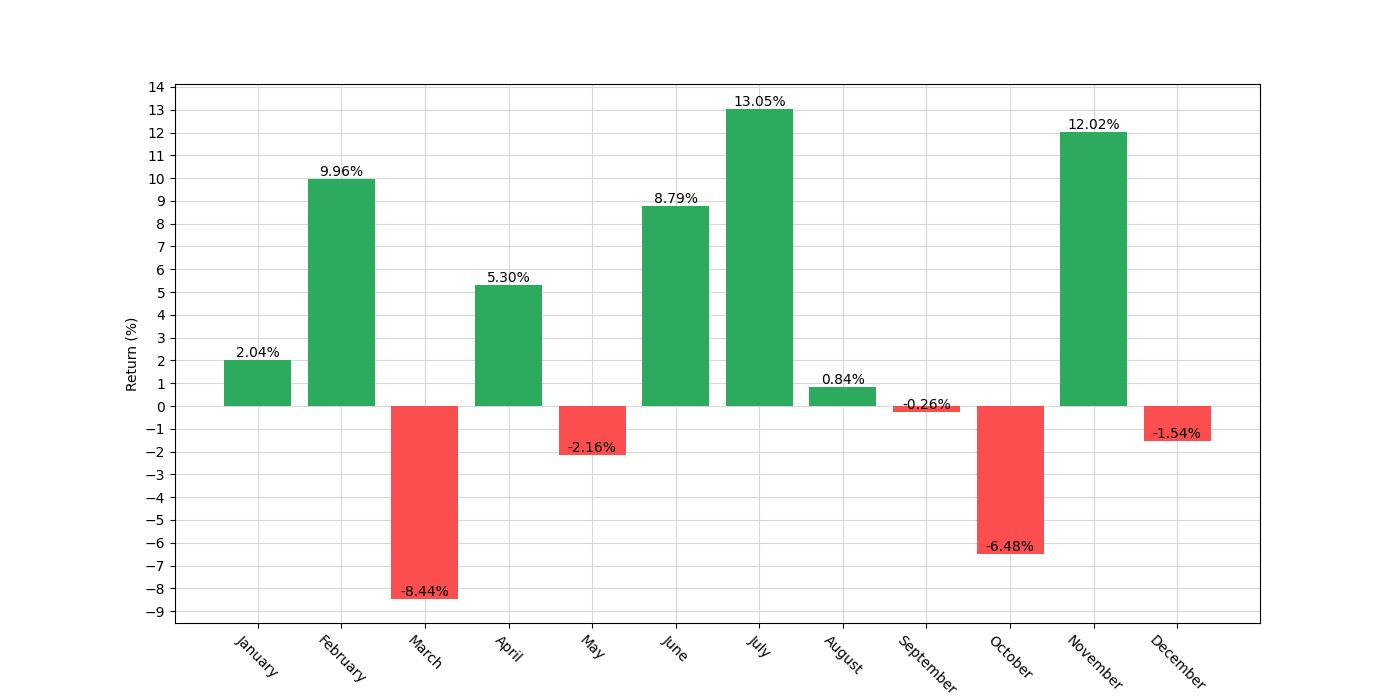
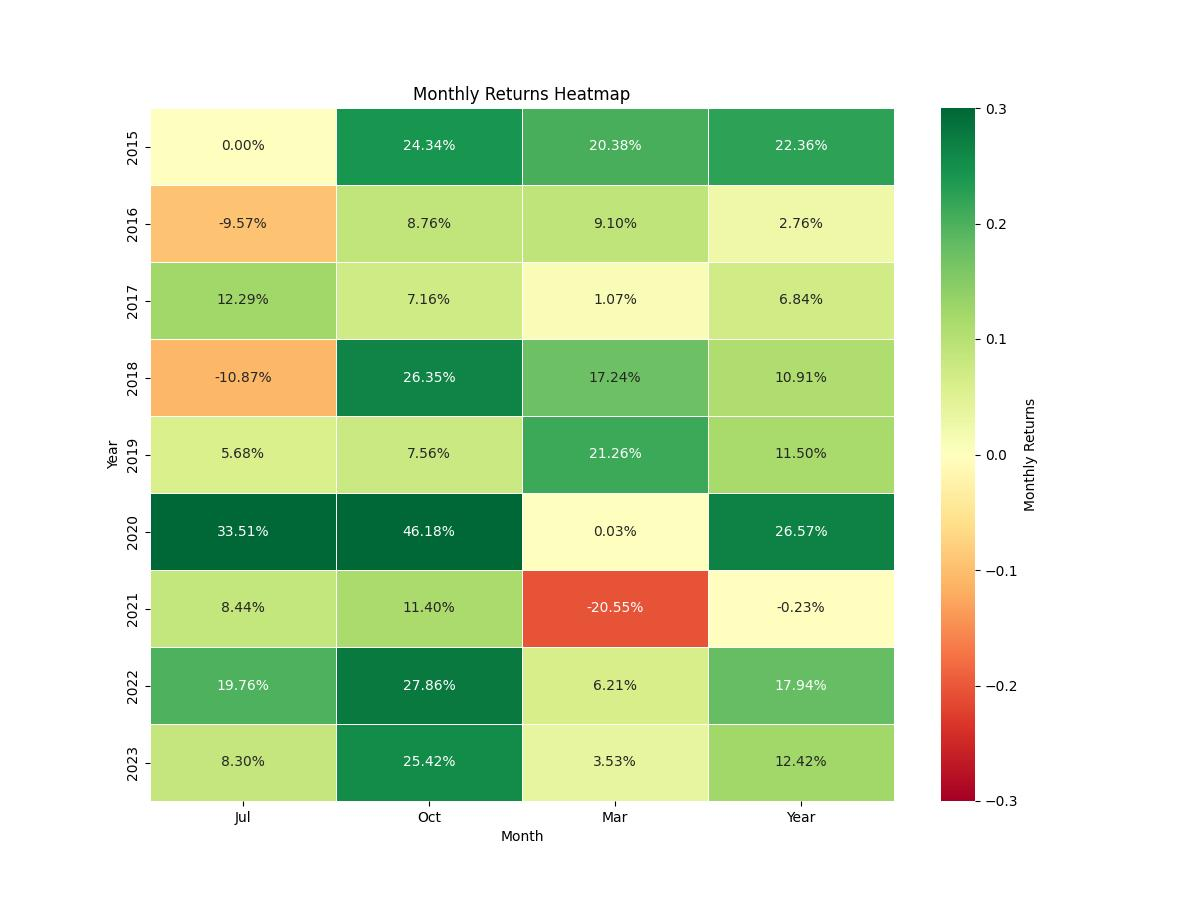
Our exploration takes us through a backtesting analysis of a monthly seasonality trading strategy performed over an extensive period, commencing on April 16, 2015, and culminating on December 29, 2023. This period, spanning 3179 days, provides a robust dataset from which to extract meaningful insights. The strategy itself is simple in its construction, yet intriguing in its application: investors are instructed to initiate a long position in Etsy’s stock during the months of June and July and conversely, to take a short position in the months of March and October.
The exposure time—defined as the percentage of the total period during which an active position in the market is held—stands at approximately 35.66%. This indicates that the strategy does not require a constant presence in the market. Instead, it operates under the premise that specific months can offer predictive insights into the stock’s performance, allowing for strategic entry and exit points.
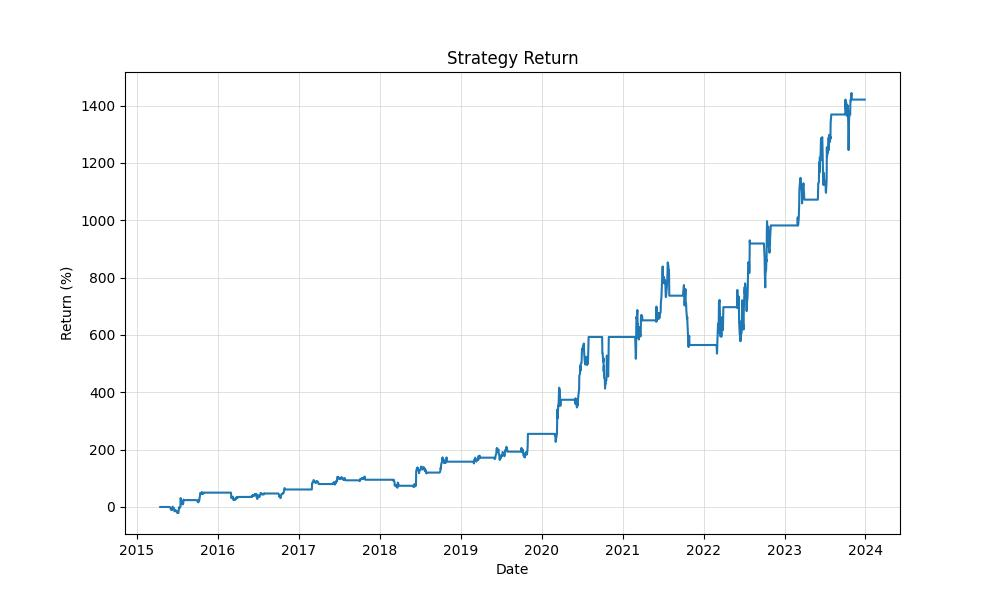
As we unpack the results of the backtest, we observe that the initial capital of $10,000 has burgeoned to an impressive final equity of $152,121.81. The peak equity reached a slightly higher watermark of $154,374.06, marking the zenith of the strategy’s performance within the testing period. This growth reflects a substantial return of over 1421%, a stark contrast to the 170% return that a simple buy and hold strategy would have yielded over the same timeframe.
Moreover, when annualized, the return on the seasonal strategy stands at an impressive 36.72%, dwarfing the annualized return of 13.31% from a buy and hold approach. It is worth noting that this return is realized with the strategy being active less than half of the time, emphasizing the potency of the seasonal approach in extracting value from the market in defined temporal windows.
The strategy’s premise hinges on the belief that certain months can predictably influence the stock’s performance due to recurring patterns, be they related to consumer behavior, company-specific cycles, or broader market dynamics. As the backtest results illustrate, this type of analysis, when executed with precision, can significantly outperform a passive investment strategy and offers a tantalizing proposition for investors looking to navigate the seasonal currents of the stock market.
Key Performance Indicators
Investors keen on maximizing their portfolio returns often look to seasonality trading strategies as a means to capitalize on consistent temporal patterns in the stock market. A compelling example of this is the backtested results of a monthly seasonality strategy applied to Etsy, Inc. Over the course of the backtesting period, which spans from April 16, 2015, to December 29, 2023, a substantial growth in equity was observed. Starting with an initial capital of $10,000, the strategy’s equity ballooned to an impressive $152,121.81.
For perspective, the peak equity during this period reached $154,374.06, showcasing the strategy’s ability to significantly outperform the initial investment. The total return achieved by this strategy was a staggering 1421.22%, dwarfing the buy-and-hold return of 170.17%. This remarkable performance indicates that the strategy not only capitalized on the most opportune times to enter the market but also timed the exits to preserve and enhance gains.
Annualized returns offer a clearer picture of the strategy’s effectiveness over time. Here, the strategy shines with a return of 36.72% on an annualized basis. This figure is particularly noteworthy when compared to the buy-and-hold annualized return of 13.31%, which represents the gains an investor would have realized by simply purchasing Etsy shares and holding onto them throughout the test period. The stark contrast between these two figures underscores the potential benefits of employing a well-conceived seasonality trading strategy.
Such robust returns are not without risk, and understanding the relationship between return and risk is crucial for investors. Volatility, a measure of the degree of variation in trading prices, stood at an annualized rate of 48.21% for the seasonality strategy. This is compared to the 75.18% annualized volatility for the buy-and-hold approach, indicating that the strategy, while still subject to significant market swings, experienced less price fluctuation than a static investment in Etsy stock would have endured over the same period.
The Sharpe ratio, which helps investors understand the return of an investment compared to its risk, was 0.76 for the seasonality strategy. Although this is below the ideal Sharpe ratio of 1 or higher, which would indicate returns are commensurate with the risk taken, it’s important to note that the ratio is substantially higher than the buy-and-hold Sharpe ratio of 0.18. This suggests that the strategy provided a more favorable balance of return versus risk.
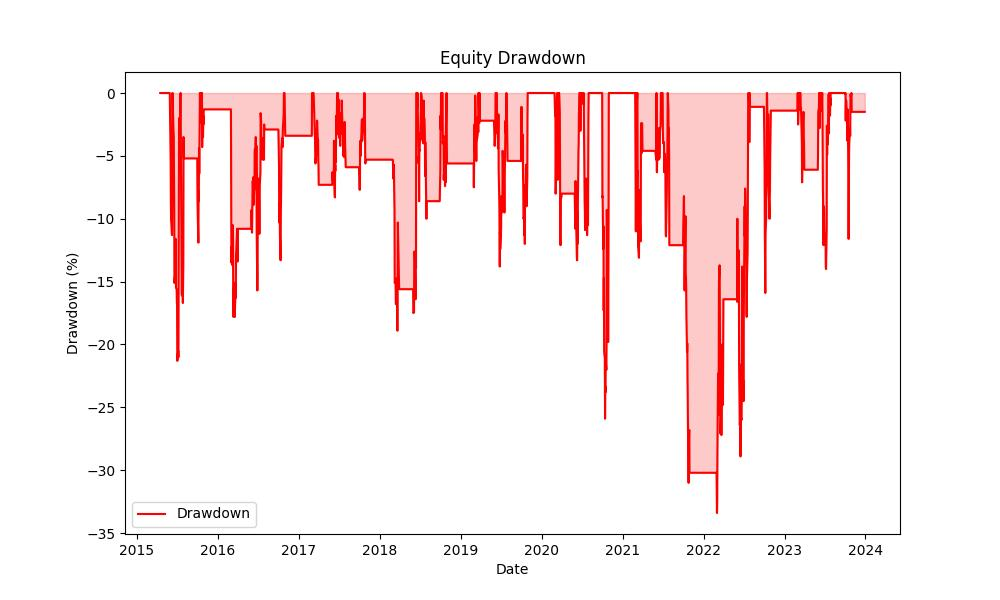
Drawdowns, or the peak-to-trough decline in the value of an investment, are an inevitable part of trading. The maximum drawdown experienced by the strategy was -33.38%, a figure that requires attention but must be viewed in the context of overall returns. The average drawdown was a less severe -8.41%, suggesting that while the strategy could experience significant declines, they were not the norm. Furthermore, the duration of these drawdowns was managed effectively, with the maximum lasting 370 days and the average just 58 days, indicating the strategy’s ability to recover from downturns relatively quickly.
Risk Management
In the realm of investing, understanding and managing risk is as crucial as identifying opportunities for profit. When analyzing the backtested performance of the monthly seasonality trading strategy applied to Etsy, Inc., several metrics offer insight into the risks associated with this approach.
A pivotal measure of risk is the strategy’s annual volatility, which stands at 48.21%. This figure indicates the extent of variability in the strategy’s returns over the course of a year. In comparison to the volatility of a buy-and-hold approach, which is significantly higher at 75.18%, our strategy demonstrates a more stable performance profile, suggesting that it may be a less turbulent journey for investors’ capital.
Delving deeper into risk-adjusted returns, the Sharpe Ratio offers a lens through which we can assess the reward per unit of risk. With a Sharpe Ratio of 0.76, the strategy exhibits a favorable balance, reflecting that the excess returns over a risk-free rate are adequate when weighed against the volatility endured. Typically, a Sharpe Ratio above 1 is considered excellent; however, considering the high growth nature of Etsy’s stock, a ratio near 0.76 could still be appealing to investors seeking growth with moderated risk.
Furthermore, the strategy’s maximum drawdown—an indicator of the largest peak-to-trough decline in the account value—is recorded at -33.38%. While this figure may initially appear concerning, it is important to contrast it with the -79.56% maximum drawdown experienced by a buy-and-hold strategy over the same period. This stark difference highlights the efficacy of the seasonal strategy in safeguarding against severe downturns.
To provide a comprehensive view of the average downturn experience, the average drawdown is cited at -8.41%, with an average duration of 58 days. These numbers suggest that while the strategy may encounter regular declines, they tend to be moderate and short-lived, potentially reducing the emotional and financial strain on investors during periods of underperformance.
When considering the duration of drawdowns, the maximum drawdown period for this seasonal strategy is 370 days. This duration is reflective of the time needed for the strategy to recover from its deepest decline to breakeven. Although this period may seem lengthy, it is considerably shorter than the staggering 1057 days seen in the buy-and-hold scenario, thereby providing solace to investors who prefer to see a recovery within a more reasonable timeframe.
Trade Analysis
In the realm of investing, a well-devised strategy is akin to a fine-tuned instrument, playing out its potential over time. When examining the backtest results of a monthly seasonality trading strategy applied to Etsy, Inc., we uncover a symphony of numbers that reveal more than just performance; they narrate a story of precision and calculated risk.
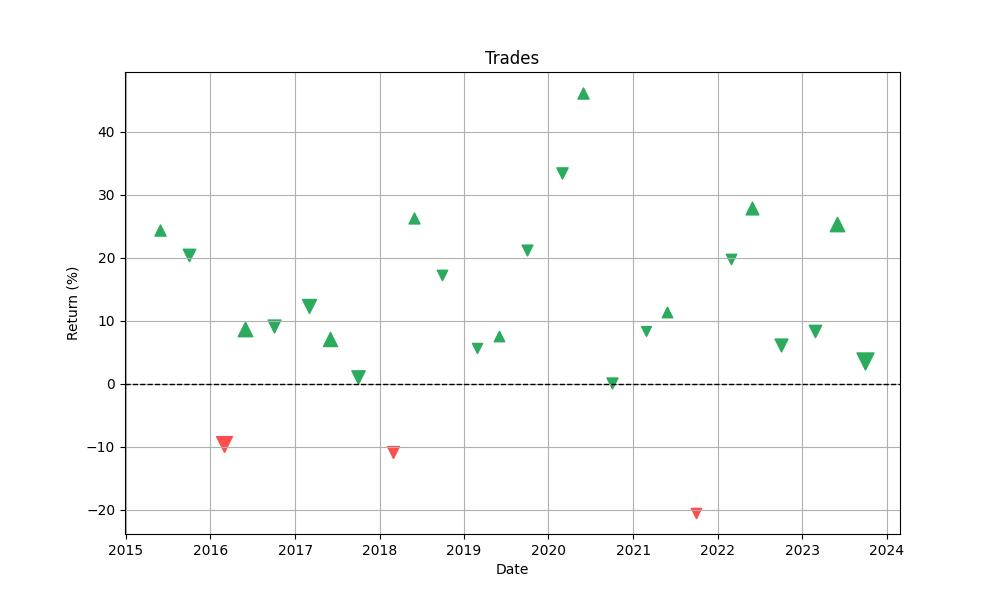
Over the backtesting period, this strategy executed a total of 26 trades. A noteworthy aspect of this approach is its high win rate, which stands at an impressive 88.46%. Such a figure suggests that the strategy is adept at pinpointing the opportune moments for entering the market, aligning with the most favorable seasonal trends.
The crescendo of the strategy’s performance is encapsulated in its best trade, which yielded a remarkable 46.18% return. This peak performance underscores the potential of capitalizing on strong seasonal patterns. Conversely, even the most harmonious melodies have their dissonances, and this strategy is no exception. The worst trade faced a 20.55% loss, a reminder that despite the prevailing success, each position carries an inherent risk.
Delving deeper into the composition, the average trade resulted in an 11.04% return, painting a picture of consistency and reliability. Moreover, the trades were not fleeting notes but sustained rhythms, with the maximum trade duration extending to 63 days and an average trade duration of 42 days. This duration indicates a strategy that leans towards a medium-term investment horizon.
The Profit Factor of this strategic opus is 8.58, a metric that harmonizes the gross profits and gross losses, ultimately demonstrating that the profits were significantly higher than the losses over the tested period. This aspect is crucial for investors as it shows the strategy’s ability to amplify gains over losses, a key component in long-term capital growth.
Expectancy, which measures the average expected return per trade, stood at a robust 11.96%. This indicator is vital as it provides an average value of what traders could expect to earn from each trade placed, after accounting for both wins and losses. A positive expectancy is akin to a recurring refrain that assures the investor of potential profitability with each trade.
When we parse through the quantified experiences of this trading strategy, we observe a tale of calculated moves and measured outcomes that have, more often than not, danced to the seasonal rhythms of the market. For retail investors considering such a strategy, these numbers offer a lens through which the robustness and potential of a seasonality-based approach can be assessed, encouraging a mindful engagement with the ebb and flow of market seasons.
Conclusion
In conclusion, the seasonal trading strategy applied to Etsy, Inc. has demonstrated an impressive ability to outperform the market by leveraging the patterns that emerge within specific times of the year. With a staggering 1421% total return over the backtest period and a robust annualized return of 36.72%, the strategy has shown that a selective approach to market participation can yield significant rewards. Furthermore, the strategy’s reduced volatility and shorter drawdown periods, compared to a buy-and-hold strategy, offer a more stable investment path with quicker recovery from market downturns.
The high win rate of trades, coupled with the strategy’s ability to minimize losses and maximize gains, underscores the efficacy of this seasonal approach. While no trading strategy is immune to risk, the backtested performance indicators suggest that the strategy has managed to strike a fine balance between risk and reward.
Investors who are looking to incorporate seasonality into their trading arsenal can take heart from the results of this strategy. It serves as a testament to the potential of using historical patterns to inform future trades, and it provides a blueprint for navigating the cyclical nuances of the stock market. The journey through the seasons of Etsy’s stock has been one of calculated precision, and the strategy’s success serves as an encouraging narrative for those willing to harness the rhythm of the market’s seasons in pursuit of investment growth.

“Make the invisible visible. My goal is to shine a light on the subtle seasonal signals in the stock market, providing investors with the insight needed to make informed decisions. By breaking down the complexities of seasonality, I strive to empower our audience with knowledge and foresight, turning data into action.”